Senior Data Scientist, London
University of Oxford · Clean technology cost curves for UK climate policy

I'm interested in making people's lives better by improving the cities they live in. I combine advanced ML, econometrics, climate modelling and complex-systems analysis to map how a city actually functions, then test what changes when you intervene.
I care about models that are interpretable, geographically faithful, and useful to those using them.
Currently a Senior Data Scientist & Software Developer at Aretian Urban Analytics, a startup out of Harvard Innovation Labs.
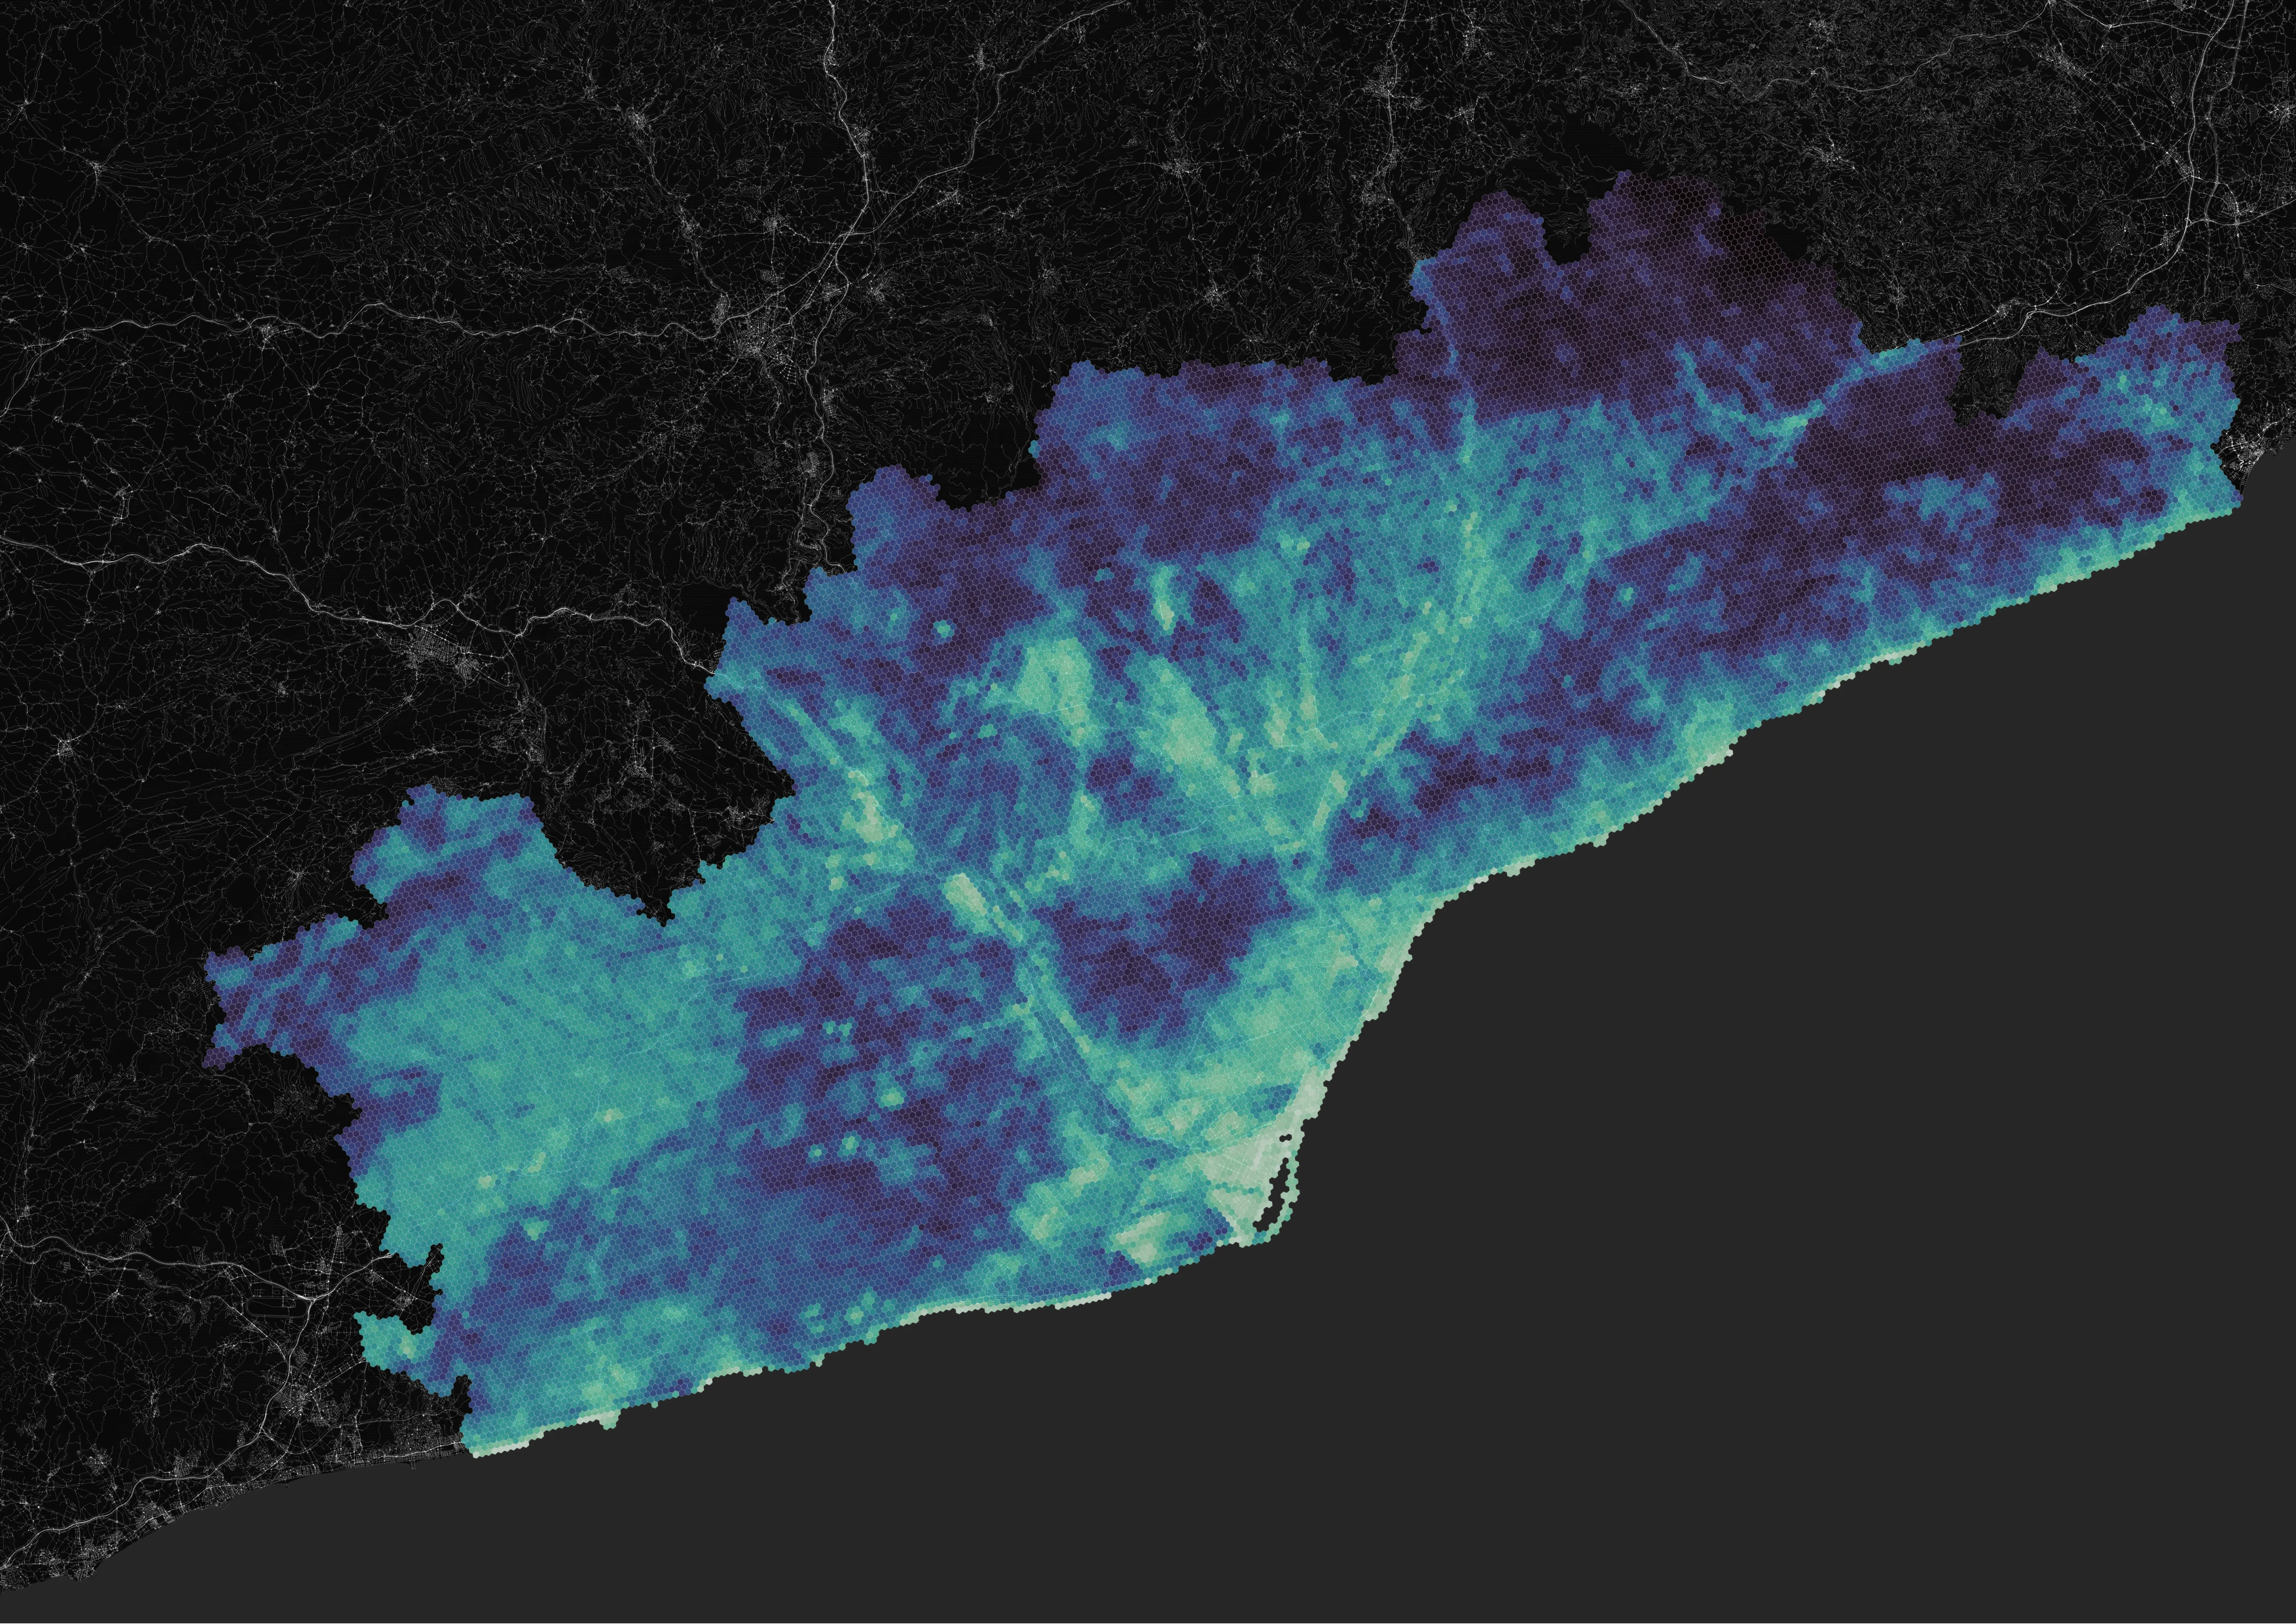
City Digital Twin, Catalunya
Geospatial intelligence platform covering 5,143 census sections across Catalunya: housing, economics, mobility and morphometrics in one map. Conducted the data science.
Visit cdt.cat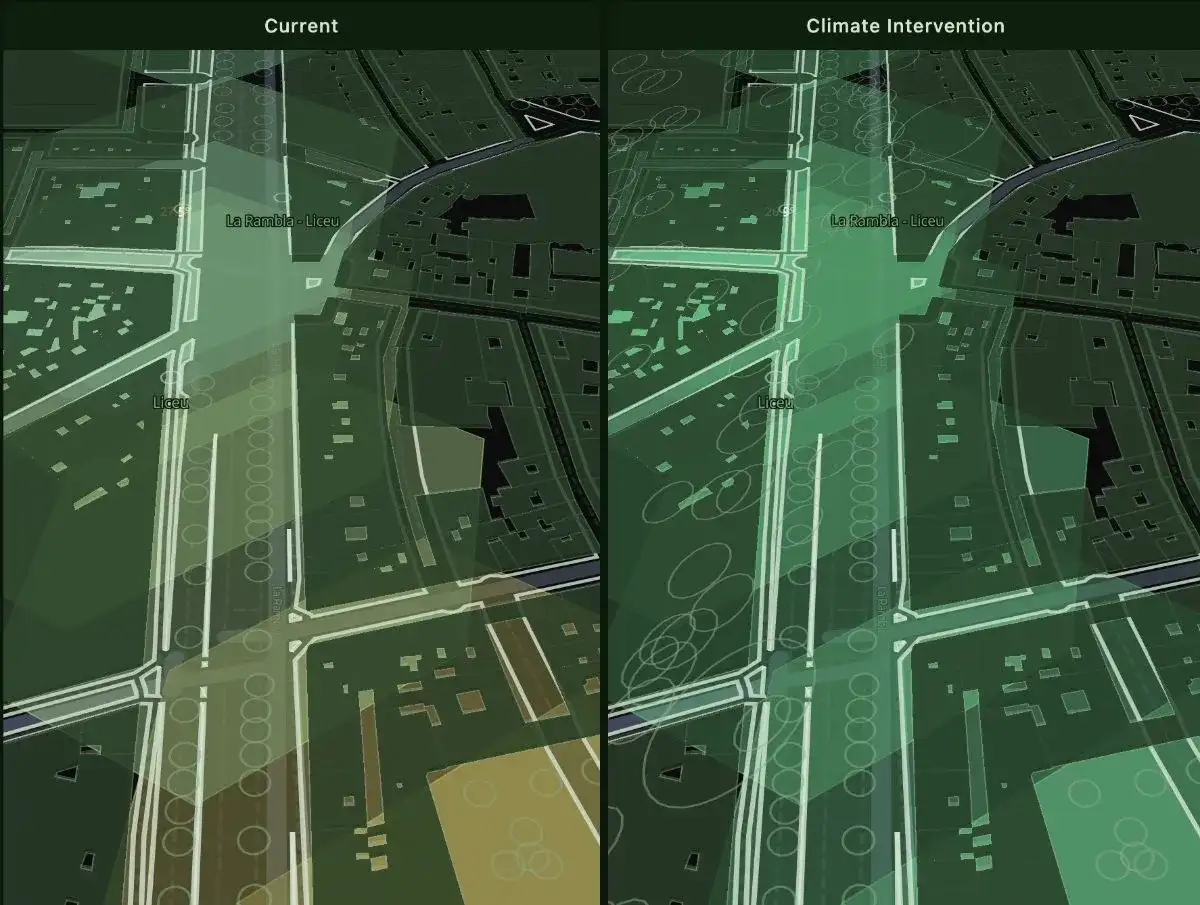
La Rambla Climate Intervention ABM
A pedestrian agent-based model of La Rambla, Barcelona, running current conditions against a proposed climate intervention side by side. Agents seek shade during heat events, so adding tree canopy and cooling amenities changes where people walk, stop and crowd, and the dashboard scores the resulting drop in heat vulnerability.
Run simulation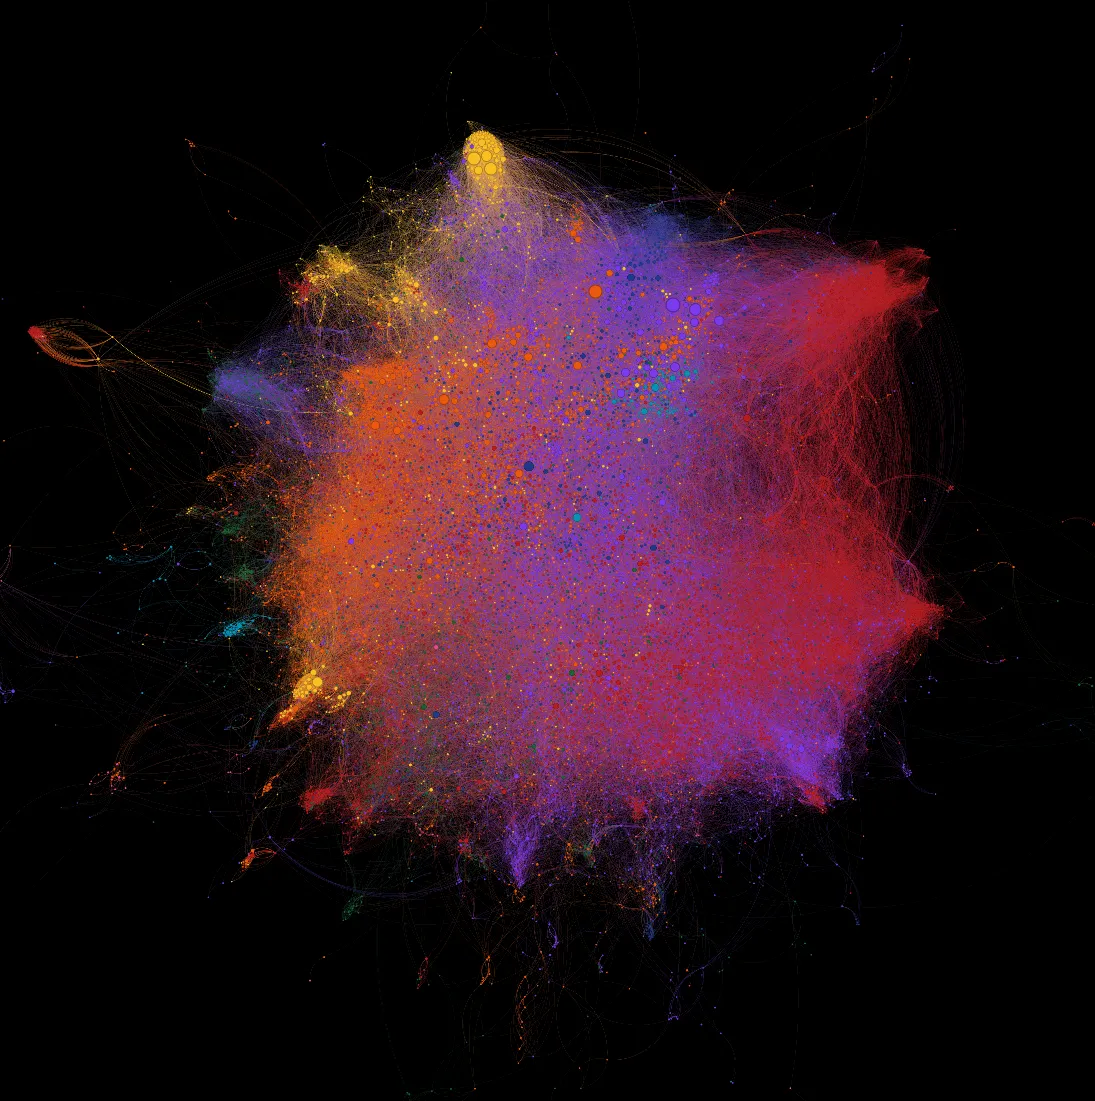
Harvard & MIT Research Networks
Interactive visualization of co-authorship networks across Harvard and MIT, exploring how collaboration drives research output.
Explore the network
Solar Valuation
This tool estimates the financial value of a solar power project by simulating thousands of possible future scenarios. Instead of relying on a single best guess forecast, it shows the full range of outcomes and their probabilities.
Open app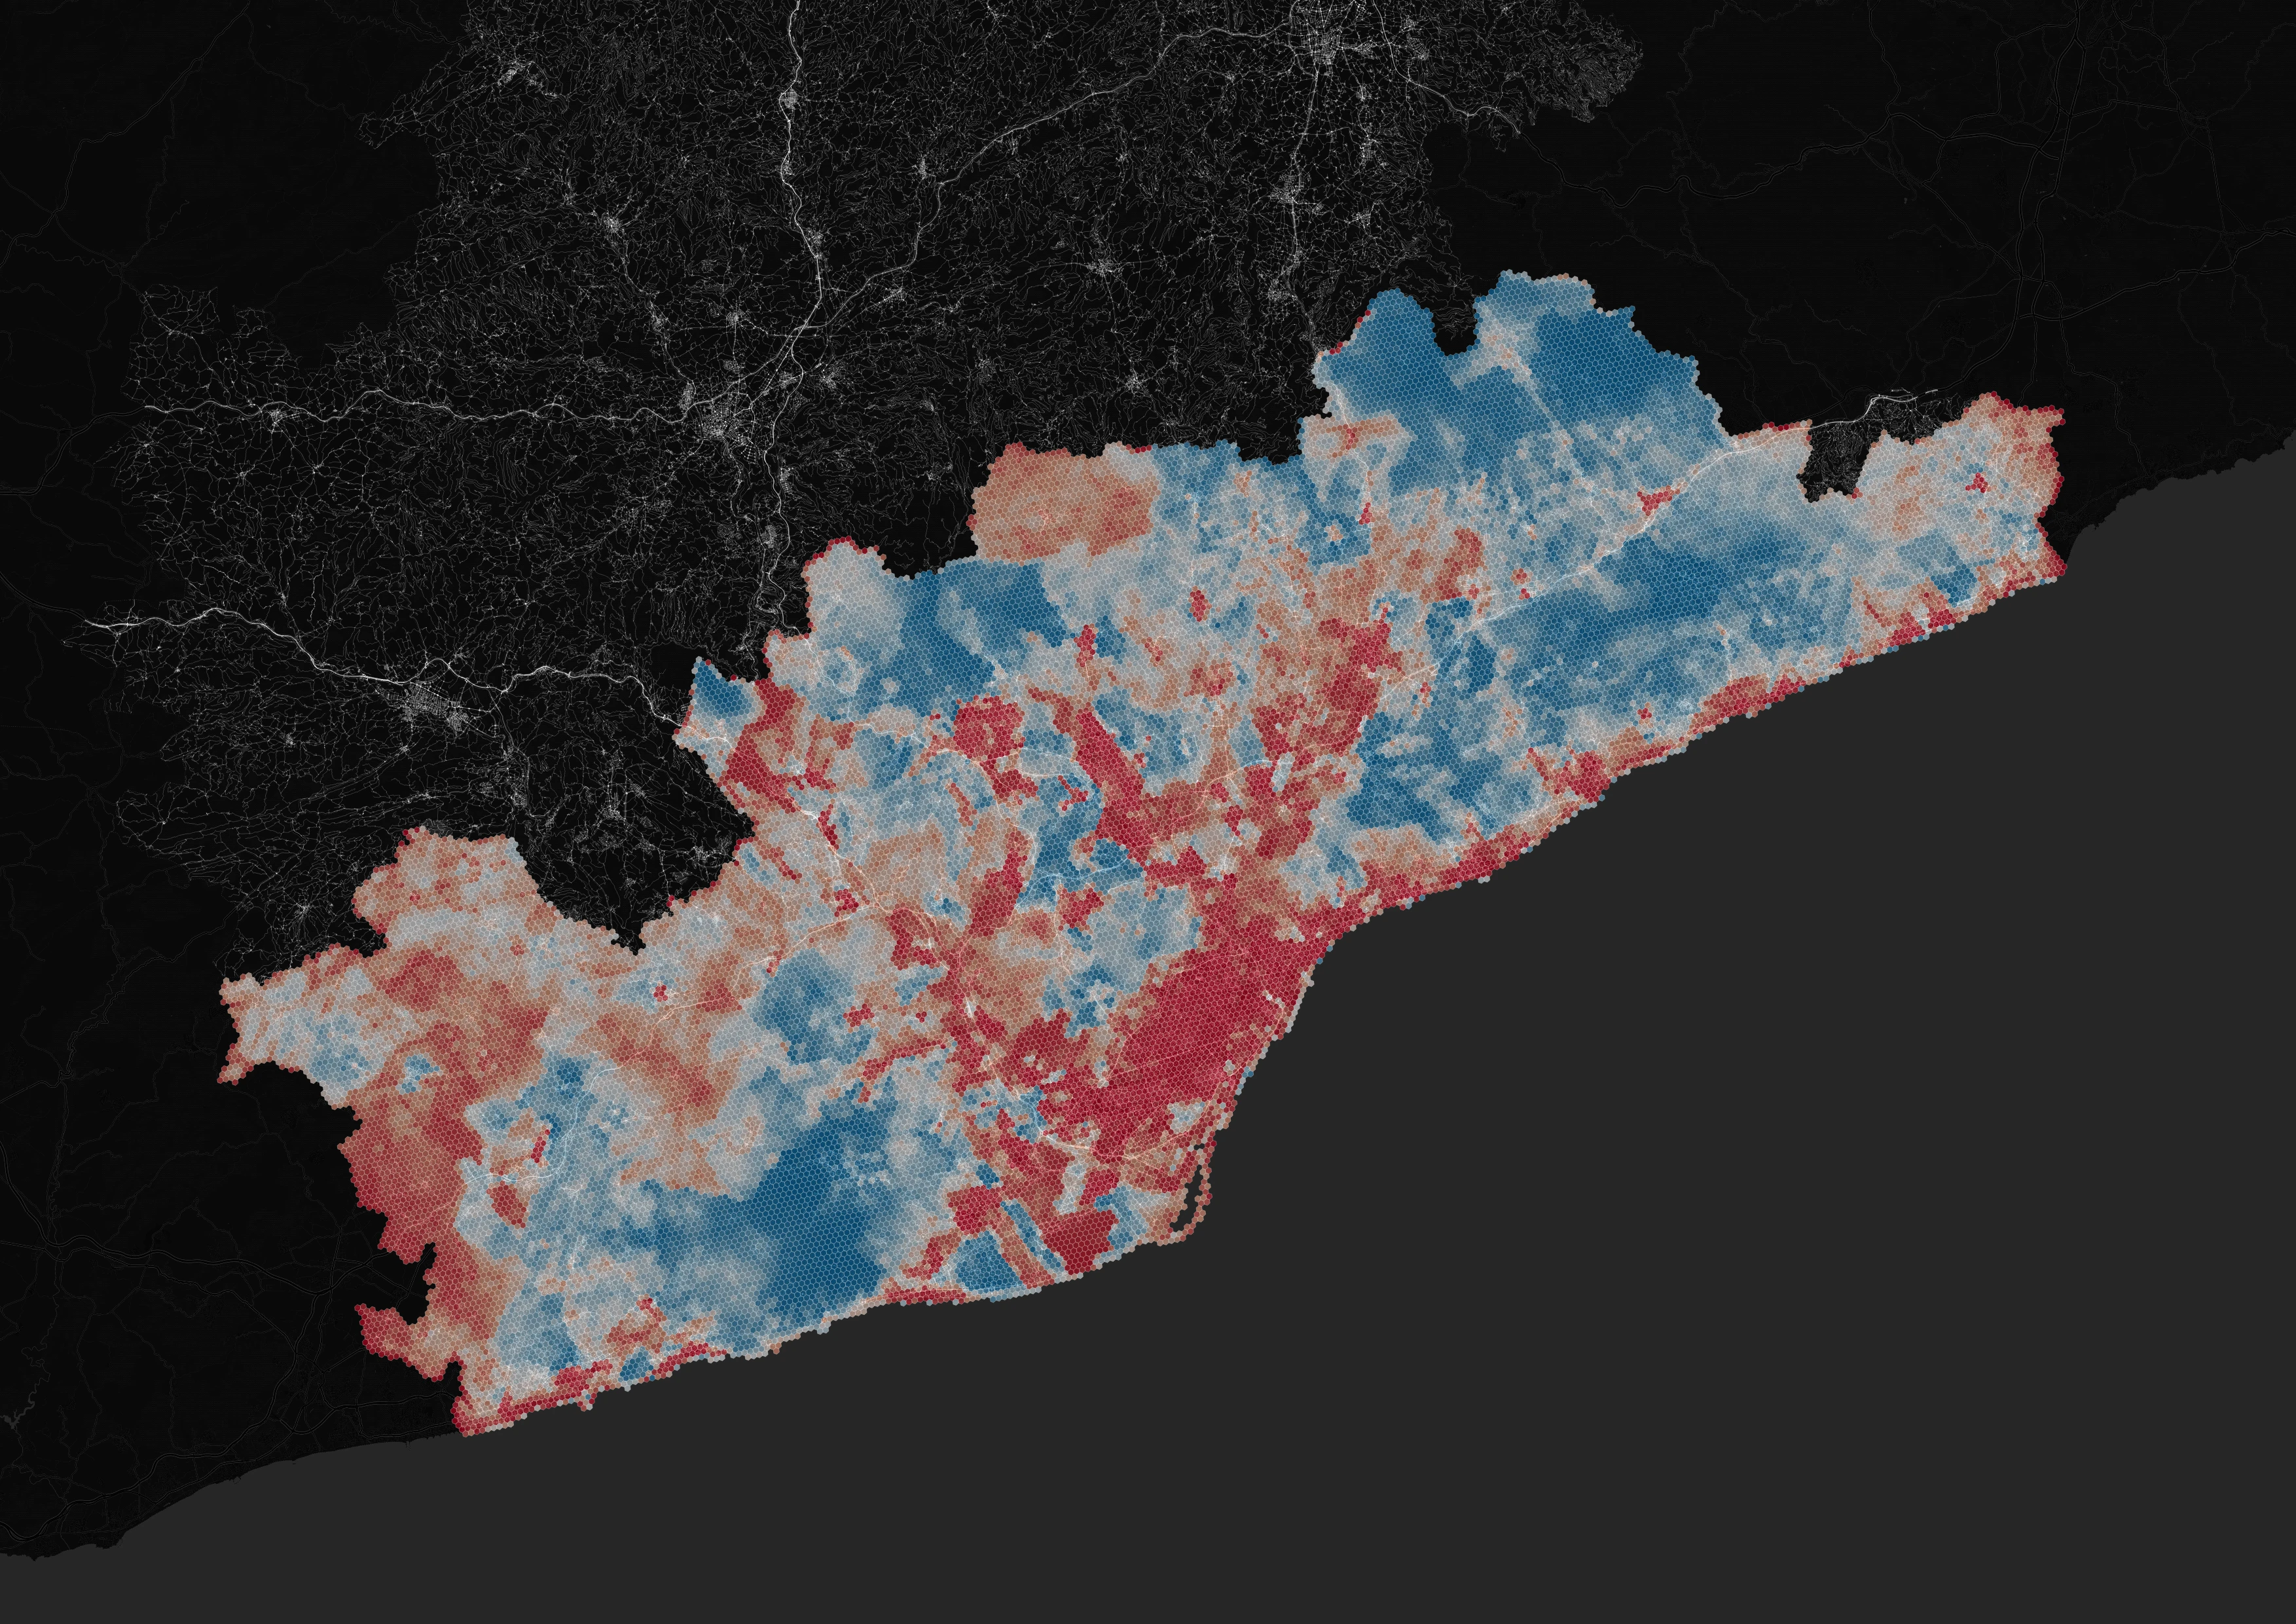
Heat Vulnerability Index, Barcelona
Over two hundred thousand hexagons across Catalunya, each scored for heat hazard, sensitivity and adaptive capacity from more than a hundred data layers. Every layer stays visible, so a bad score can be traced back to exactly what caused it.
Read write-up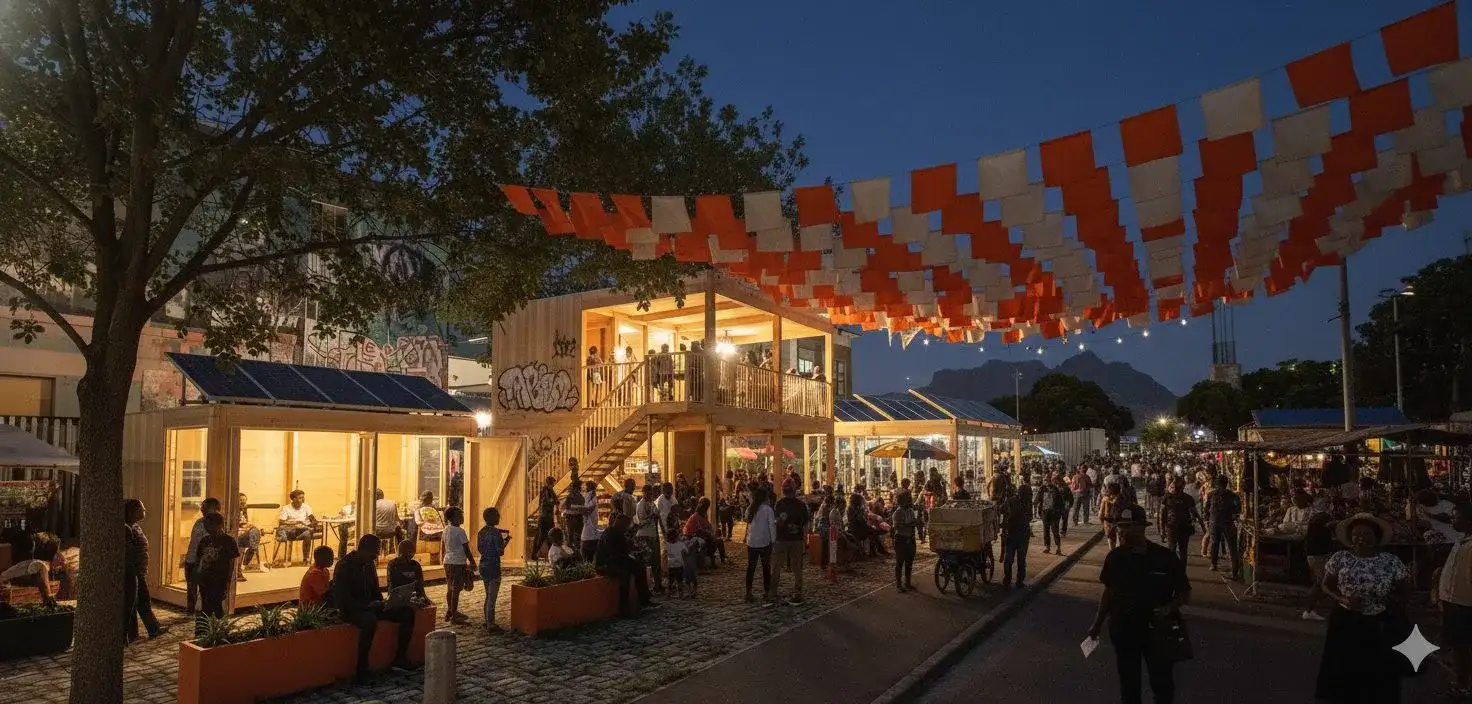
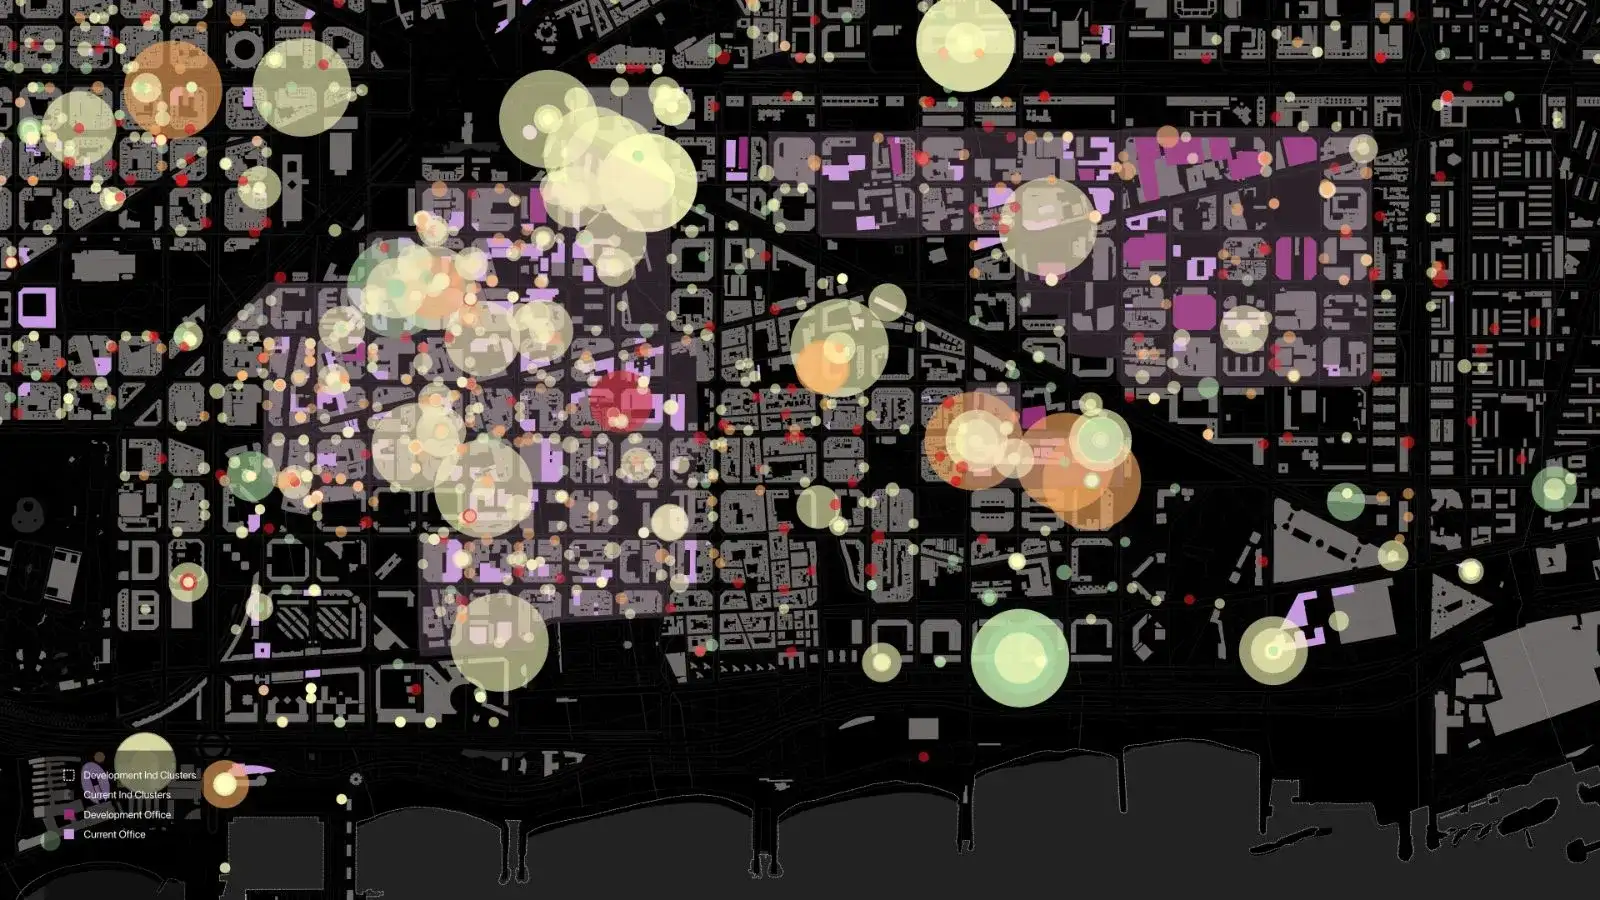
Cape Town: Opportunity Hubs
Mapped access to opportunity across Cape Town's transport, employment and racial-segregation geography, then designed Opportunity Hub interventions at metropolitan and neighbourhood scale, piloted in the CBD and Langa.
Read report