Heat vulnerability, layer by layer
The ability to think spatially is critical to combatting the effects of climate change. Impacts are almost always localised thus needing geographic context to tackle effectively.
The approach
Climate risk isn't evenly spread across a city. Walk a few blocks in Barcelona and everything changes. The ground rises, trees disappear, buildings get older, the population shifts. A heatwave that barely registers in a leafy hillside neighbourhood can be deadly in a dense, paved district near the coast. Flooding that devastates one street might not touch the next.
Most climate assessments ignore this. They produce a single risk score for an entire city, which is a bit like describing a hospital as “moderately healthy” because you averaged all the patients. It tells you almost nothing useful.
So we built something different. We divided Catalunya into a grid of hexagons, over two hundred thousand of them at the finest level, and attached more than a hundred data points to each one. Temperature. Vegetation. Building age. Income. How many people are over sixty-five. How far to the nearest hospital. How far to the nearest metro station. Whether the local drainage system is known to overflow.
The approach follows a simple logic: vulnerability isn't one thing, it's three. There's the hazard itself, meaning how hot does it get, or how likely is flooding. There's sensitivity, meaning who lives there, how old are they, how exposed are their daily lives. And there's adaptive capacity, meaning can people cope, do they have resources, is there green space, are the buildings designed for this. We model each separately, from separate data, and only combine them at the end.
This separation reveals patterns that a single number would hide. Take flooding. You might expect poorer areas to be most at risk. But in Barcelona, some of the highest flood vulnerability scores land in wealthy coastal neighbourhoods. Why? Because waterfront property is expensive. People pay a premium to live near the sea, near rivers, in the low-lying heart of the city, exactly where flood risk concentrates. Income and hazard exposure move together, not apart. A simple vulnerability score would average this away. Keeping the components separate shows what's actually happening.
The data behind all this is surprisingly mundane. Satellite imagery tells us where the trees are and how hot surfaces get. Cadastral records, the property registry, tell us when every building was constructed. Census data tells us who lives where and what they earn. Climate archives give us forty-three years of temperature and rainfall records. None of it is exotic. Most of it is public.
What those records show is sobering. Catalunya has warmed by half a degree every decade since 1979. That trend is statistically significant in every single one of the region's five thousand census tracts. Not most, all of them. Meanwhile, three quarters of the building stock went up before 1980, which means before Spain had any thermal insulation standards. These buildings were designed for a climate that no longer exists.
We've modelled two hazards so far: extreme heat and flooding. For heat, the model combines temperature and air quality with demographic vulnerability and the presence of trees and green space. For flooding, we break it into four pieces: where floodwaters actually go, where drainage systems are known to fail, what assets and people are in the way, and whether residents have the resources to recover.
Every layer stays visible. If a neighbourhood scores badly, you can trace it back to exactly why. The lack of vegetation, the age of the buildings, the distance to emergency services, the share of elderly residents living alone. This matters because a score you can't explain is a score you can't act on. The point isn't to produce alarming maps. It's to show a city planner exactly where intervention would help, and what kind.
The composite index
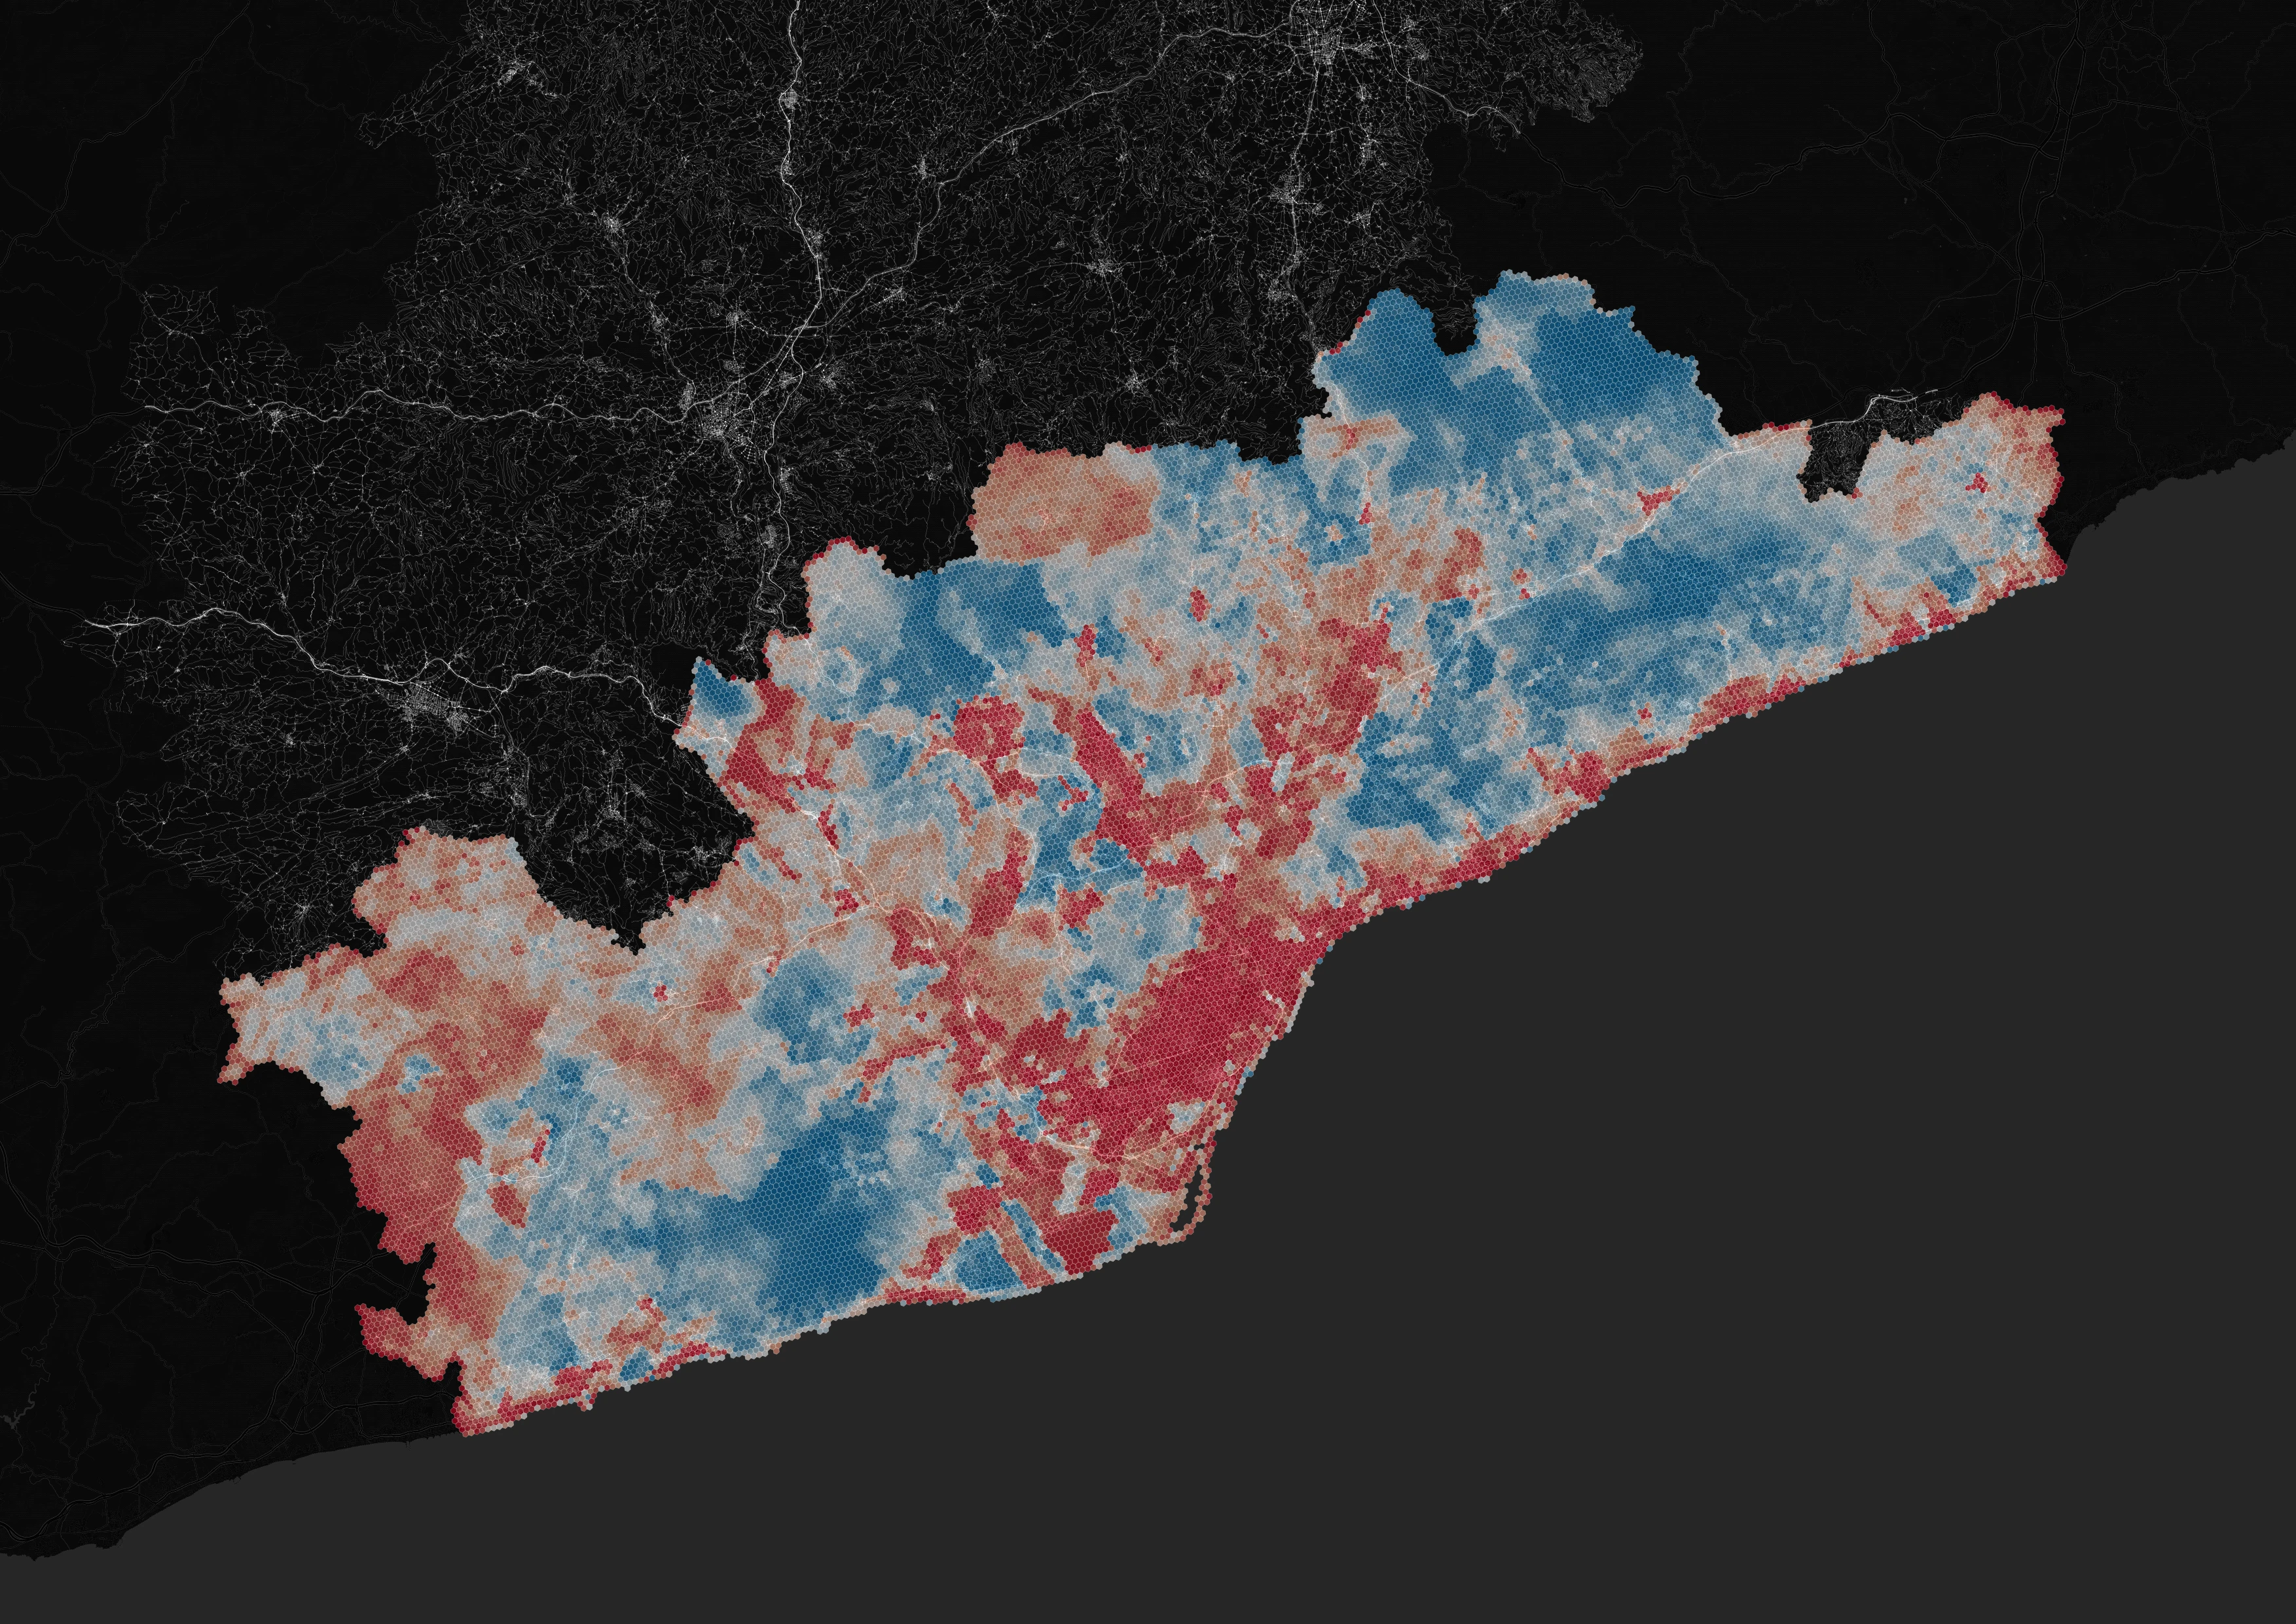
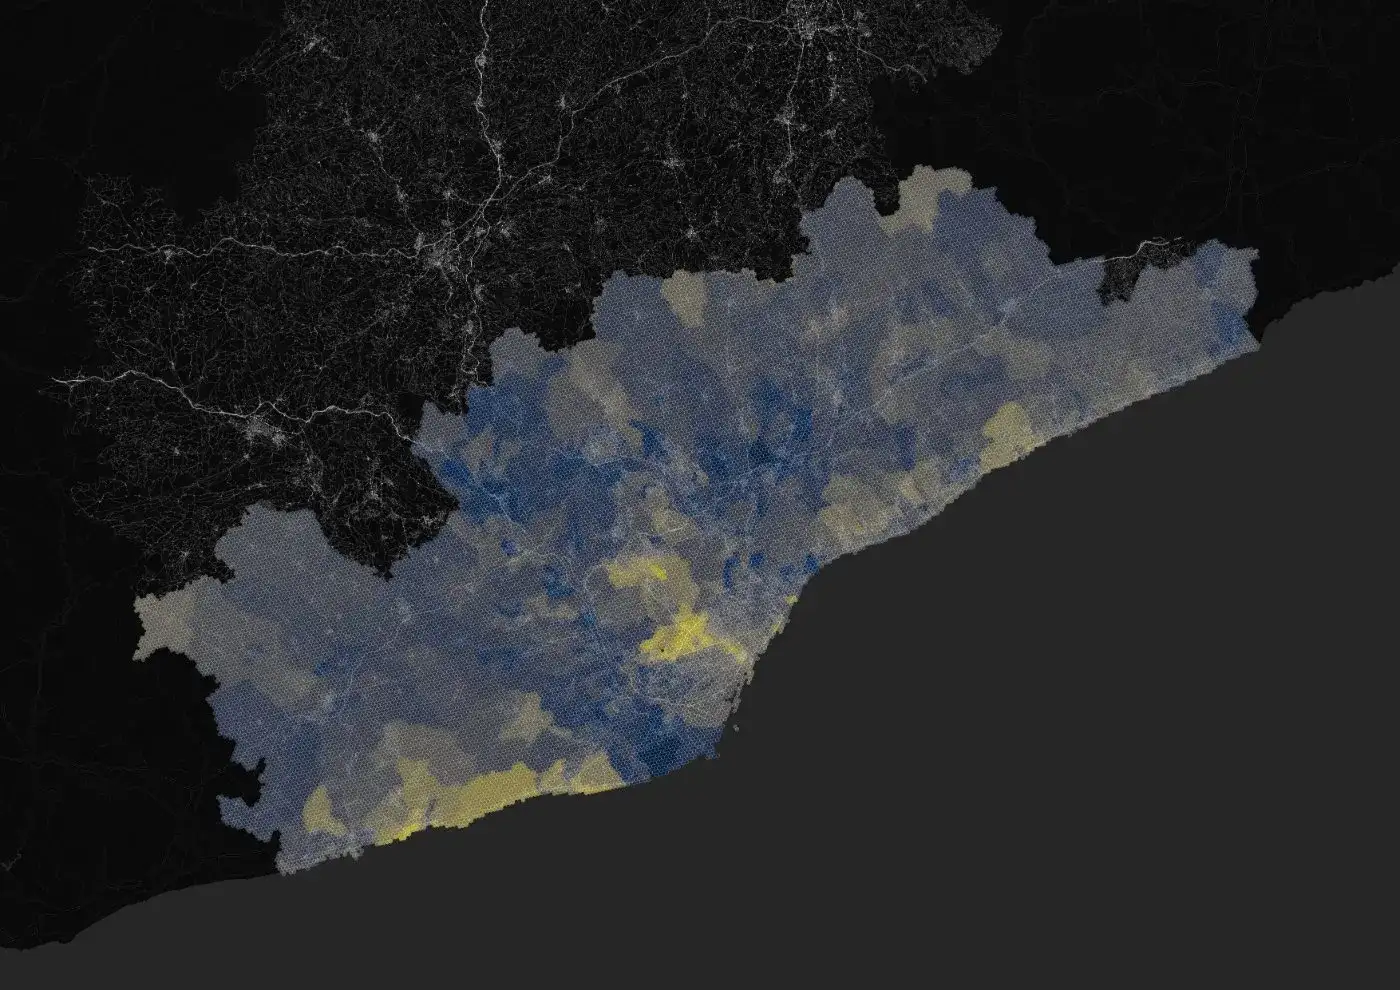
The final output: every hexagon in the region scored from low to high heat vulnerability. The worst scores combine sustained high temperatures with an older population, older buildings and little access to cooling. Lighter areas are comparatively safe.
Three pillars
The index is built from three separately modelled dimensions. Hazard is how hot it gets; sensitivity is who is exposed to it; adaptive capacity is how well a place can respond.
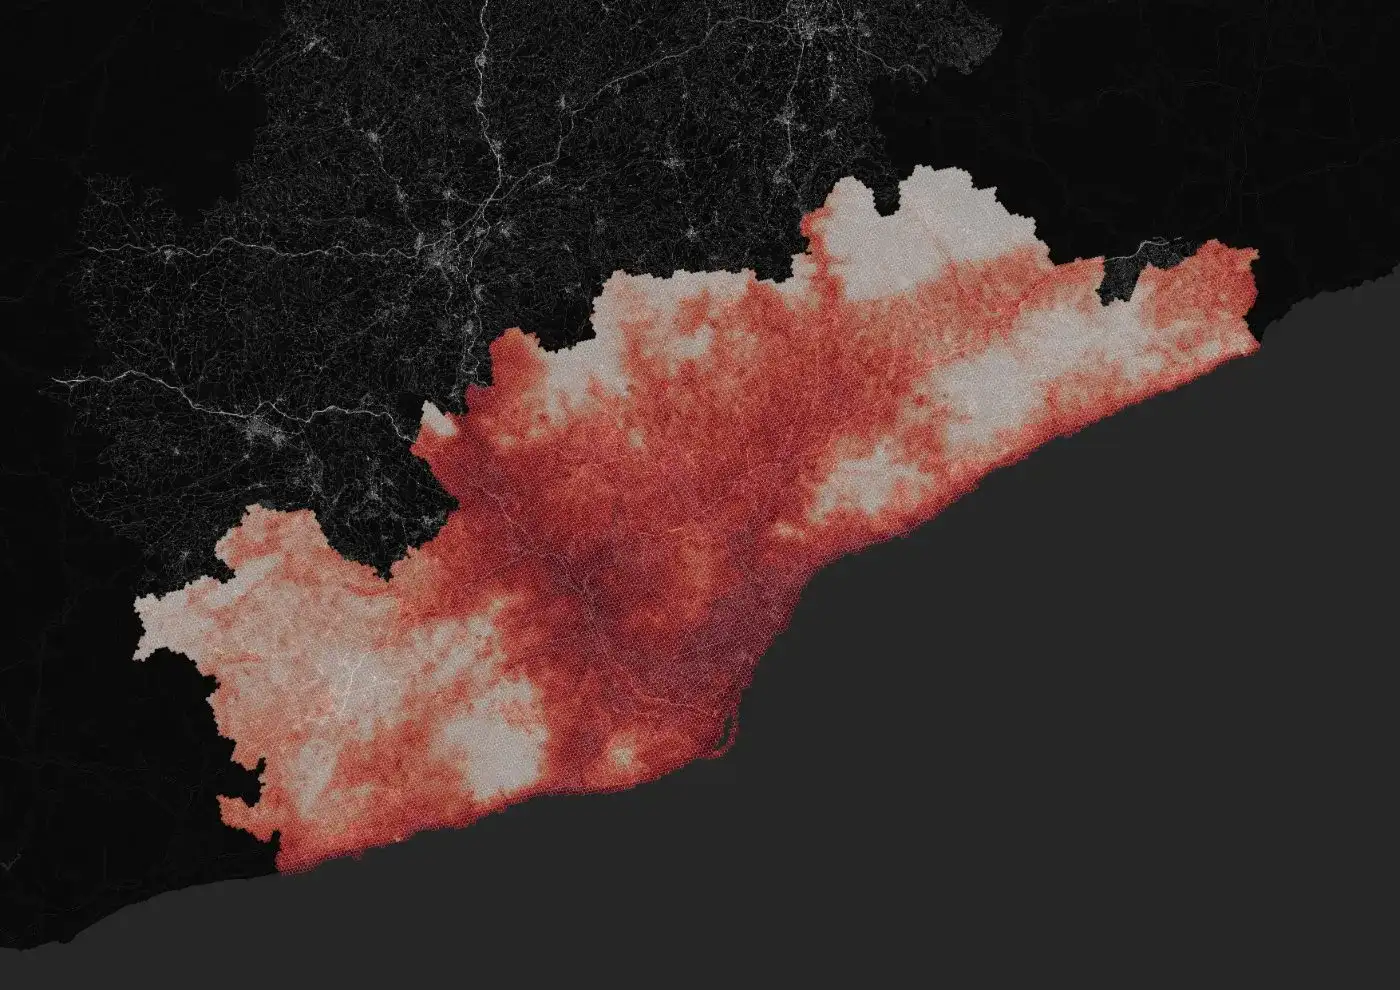
Summer temperature, tropical nights and surface reflectivity combined into one measure of how hot a place gets and how long it stays hot.
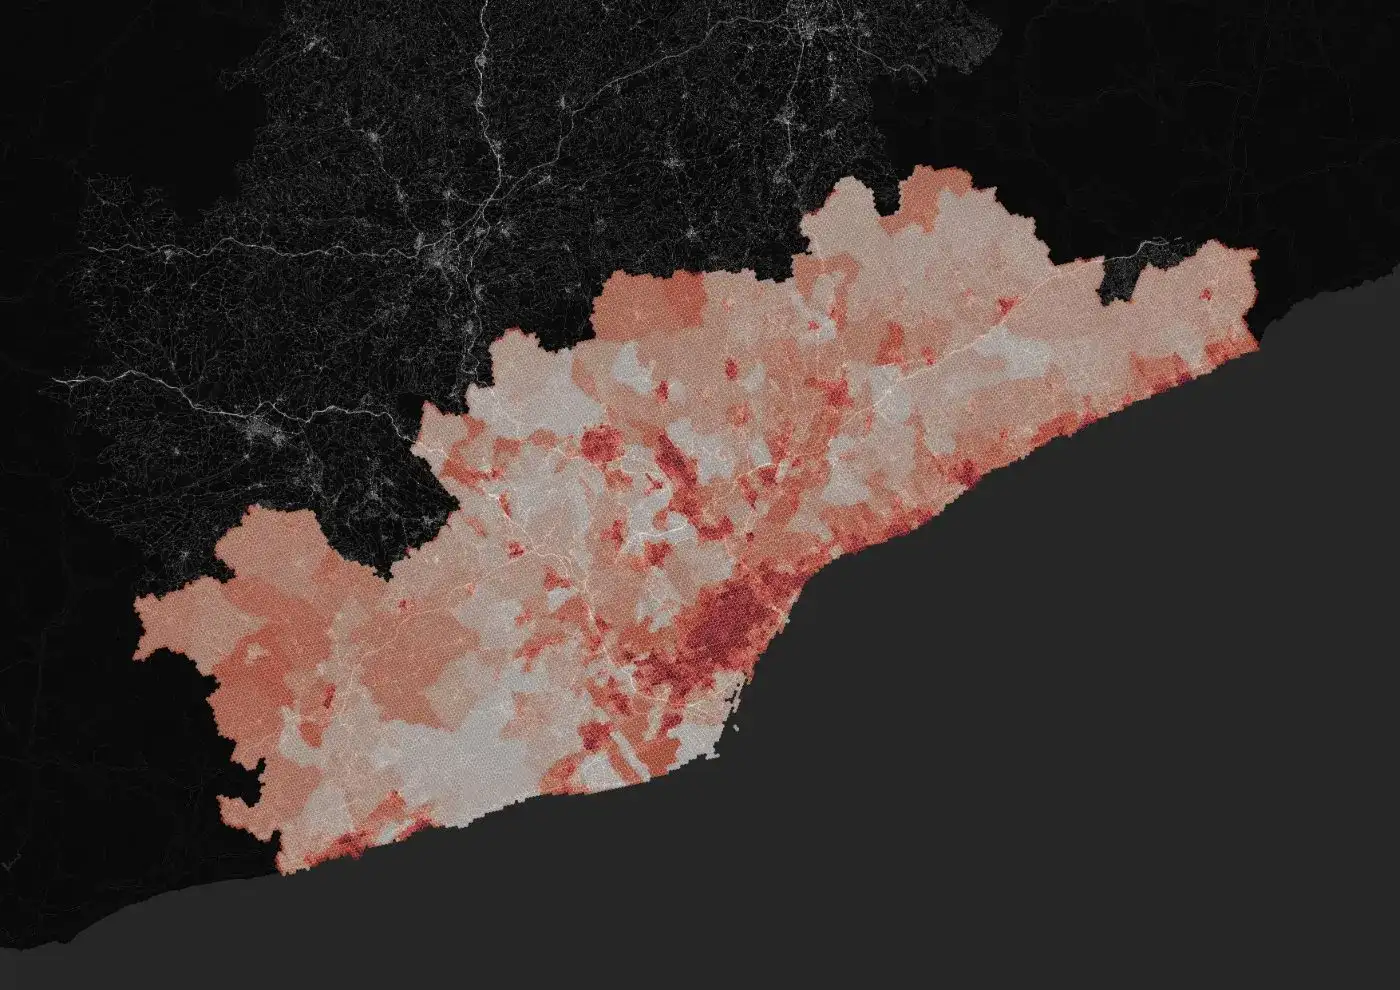
Who is exposed: the share of residents over sixty-five, population density, and the age and condition of the buildings they live in.
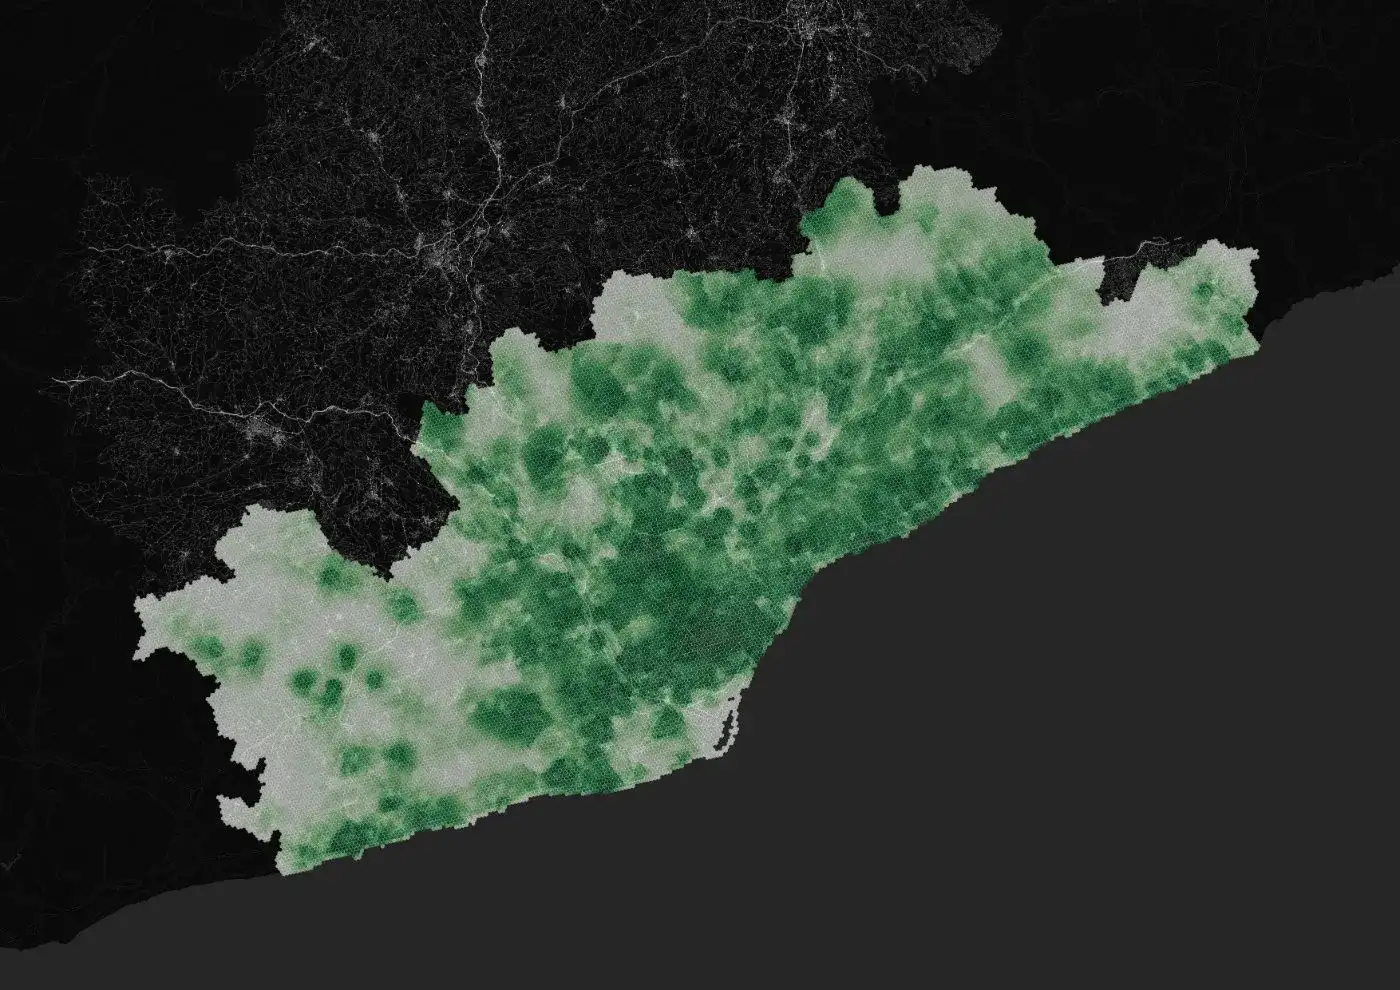
Income, inequality and access to cooling: the resources a neighbourhood has to get through a heatwave.
Hazard inputs
How hot it gets, how long the heat lasts, and what the landscape does to amplify or absorb it.
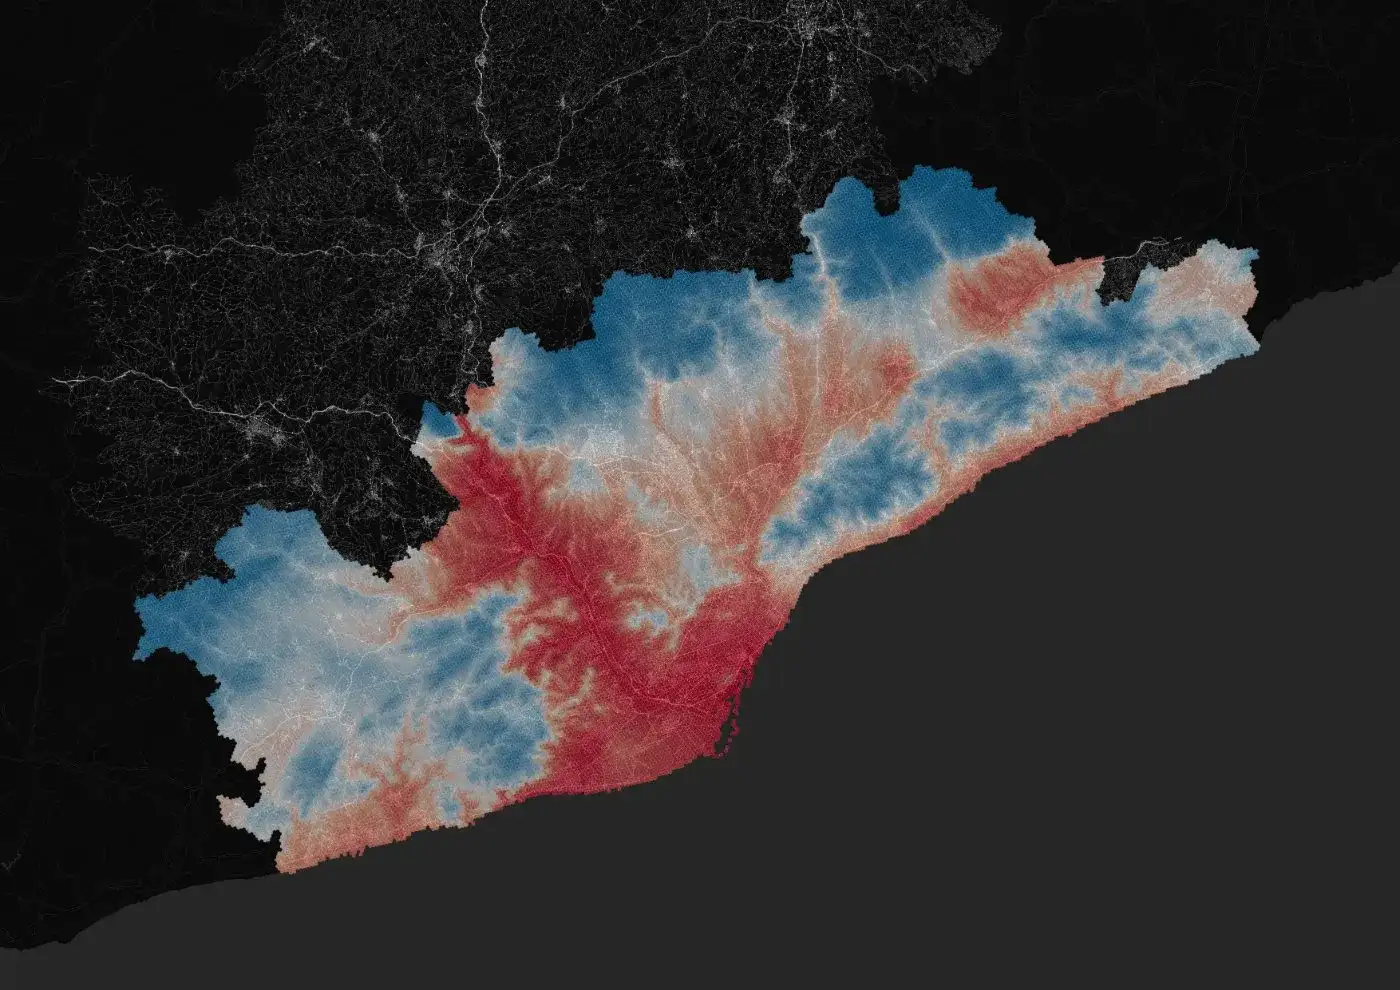
Average summer temperature, reconstructed from four decades of climate records.
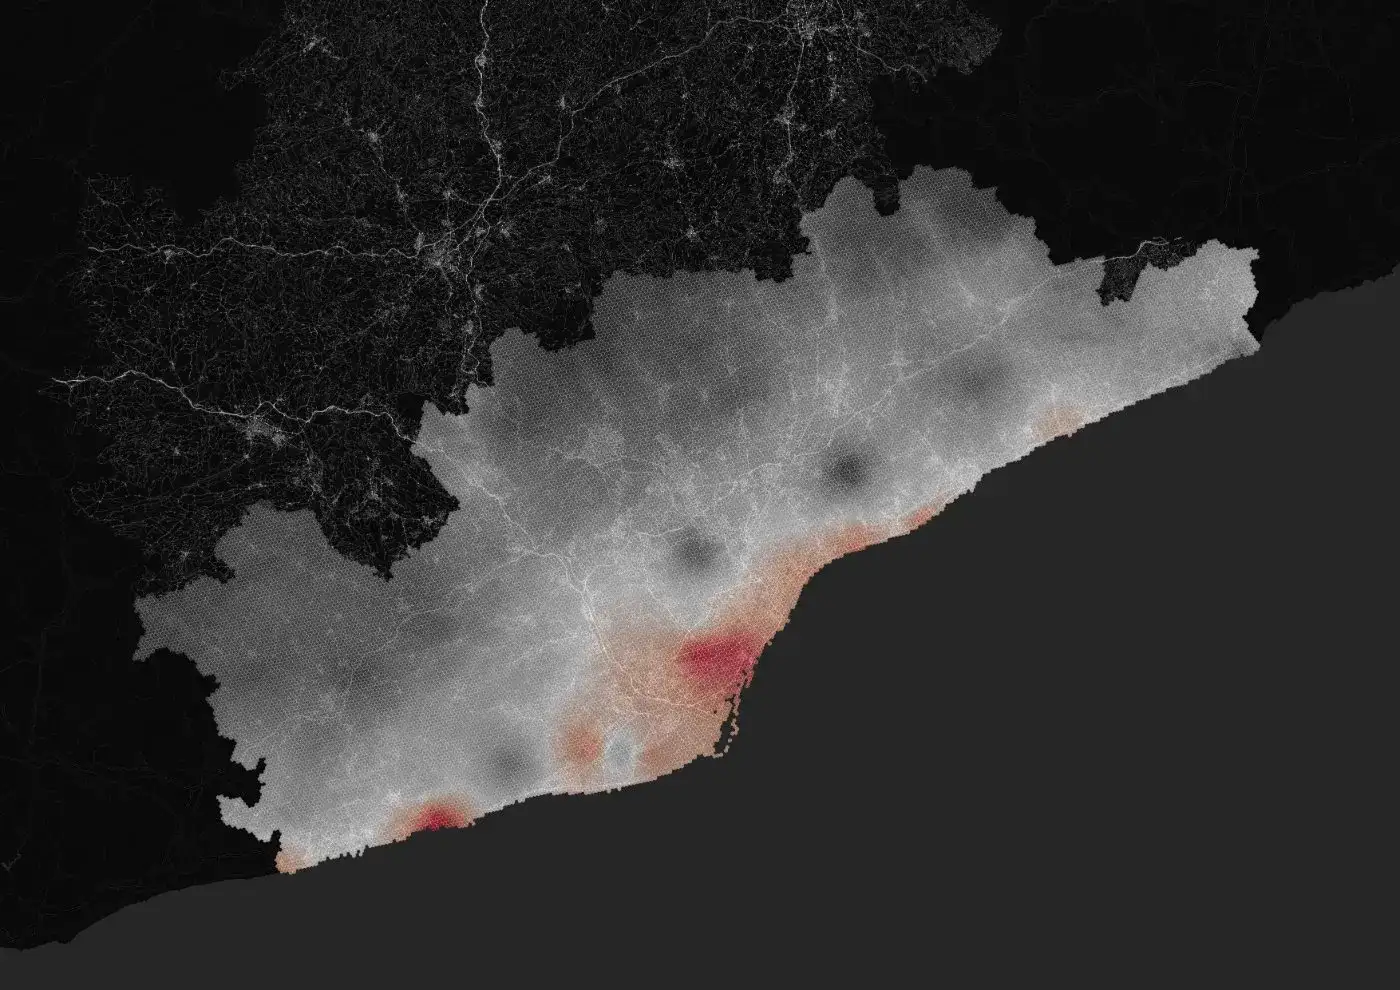
Nights that never drop below 20°C, when the body cannot recover from the day's heat.
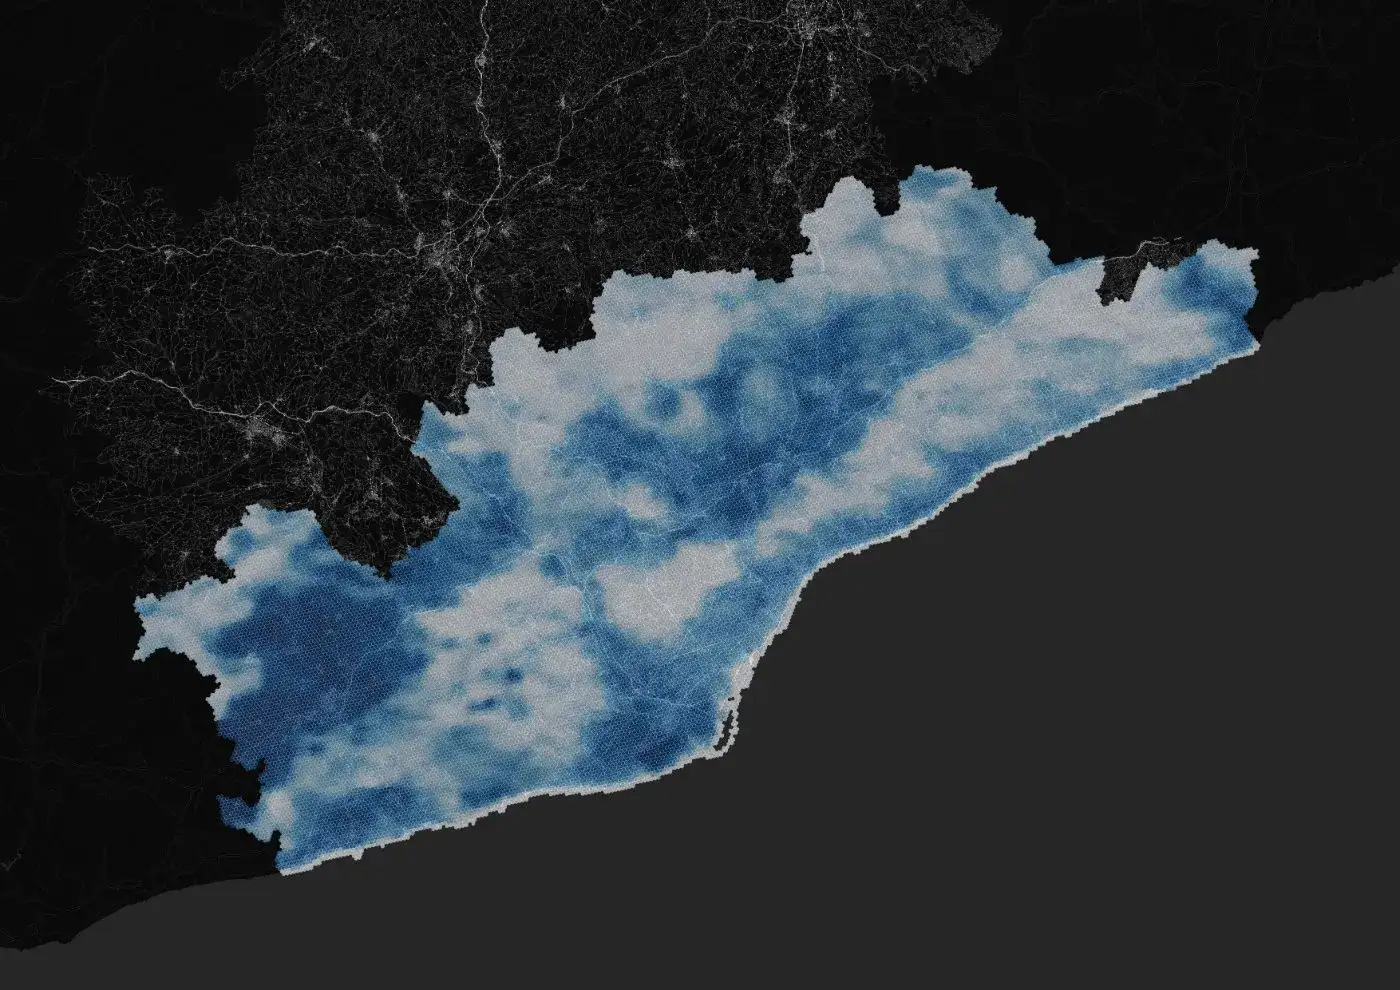
How much sunlight the ground reflects rather than absorbs. Dark roofs and asphalt hold heat.
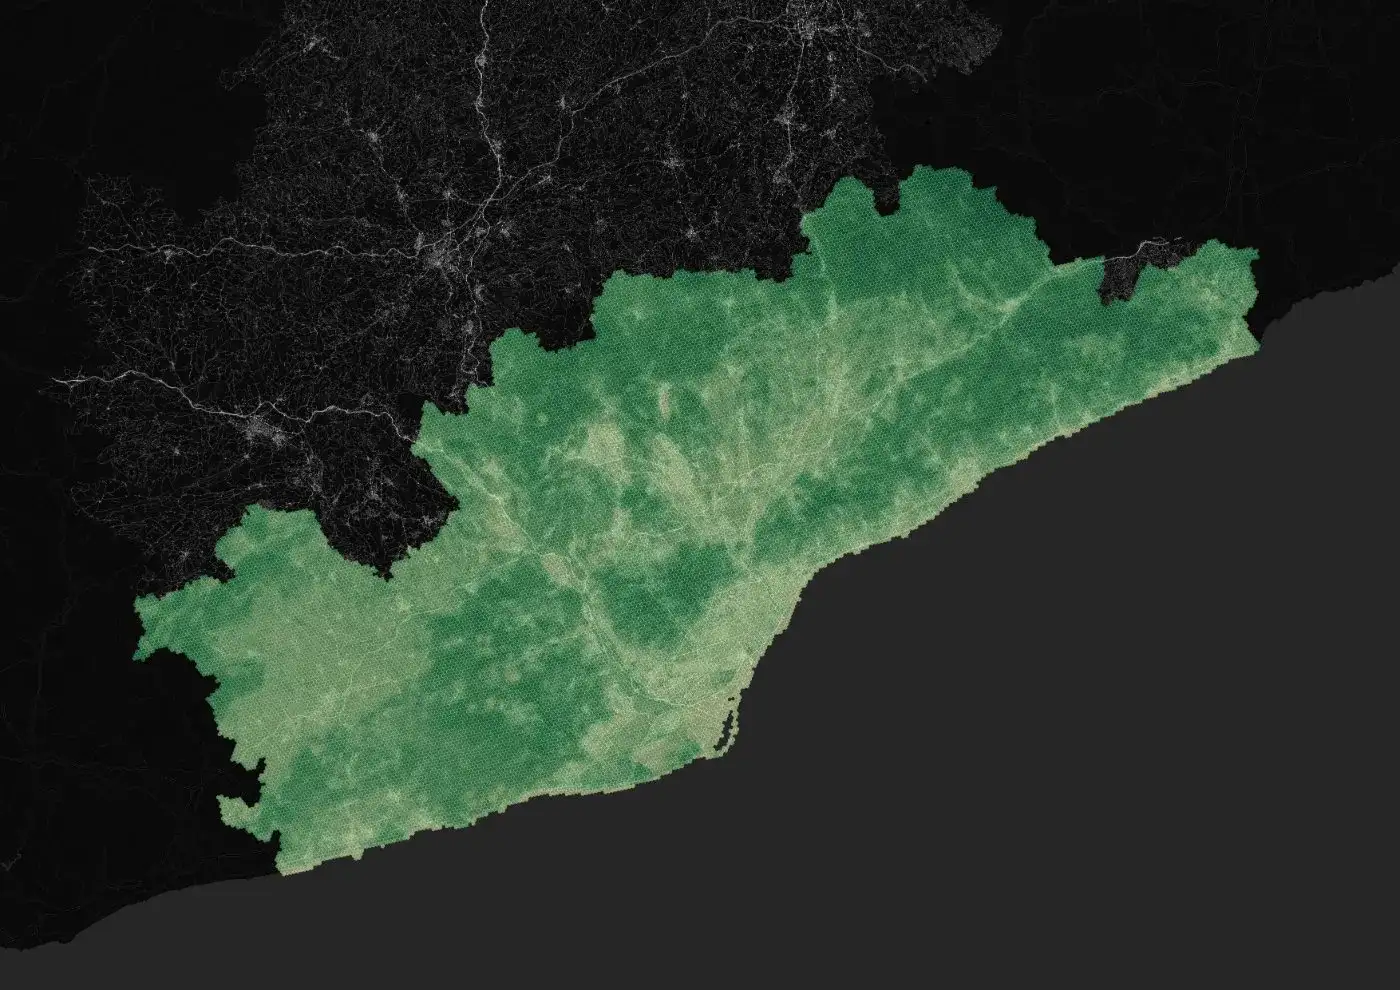
Green cover measured from satellite, the strongest natural cooling a city has.
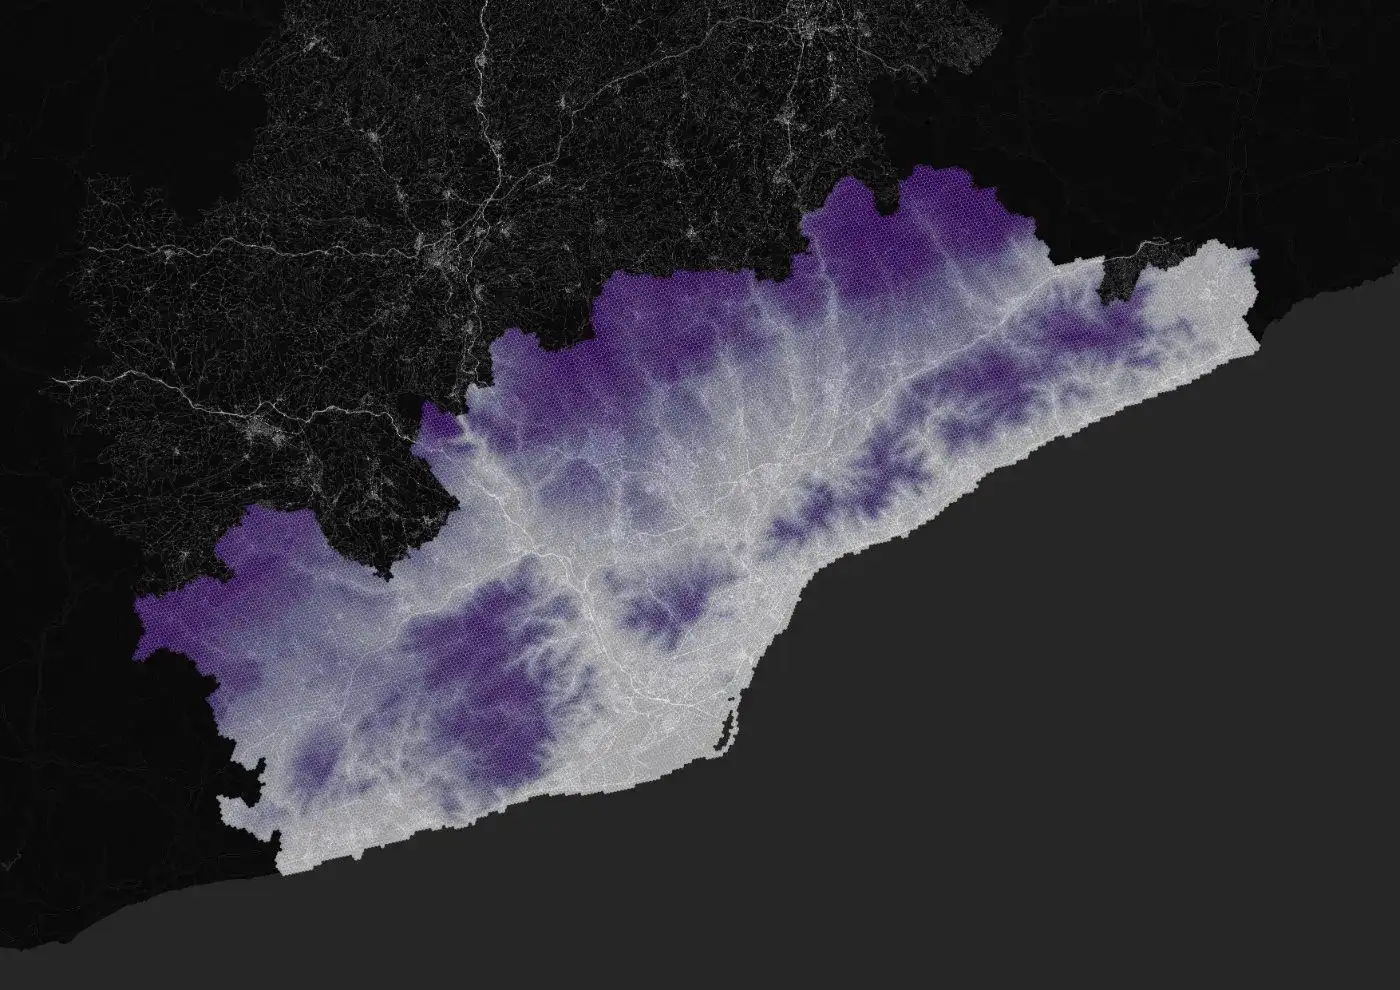
Height above sea level, which sets the baseline temperature before anything built is accounted for.
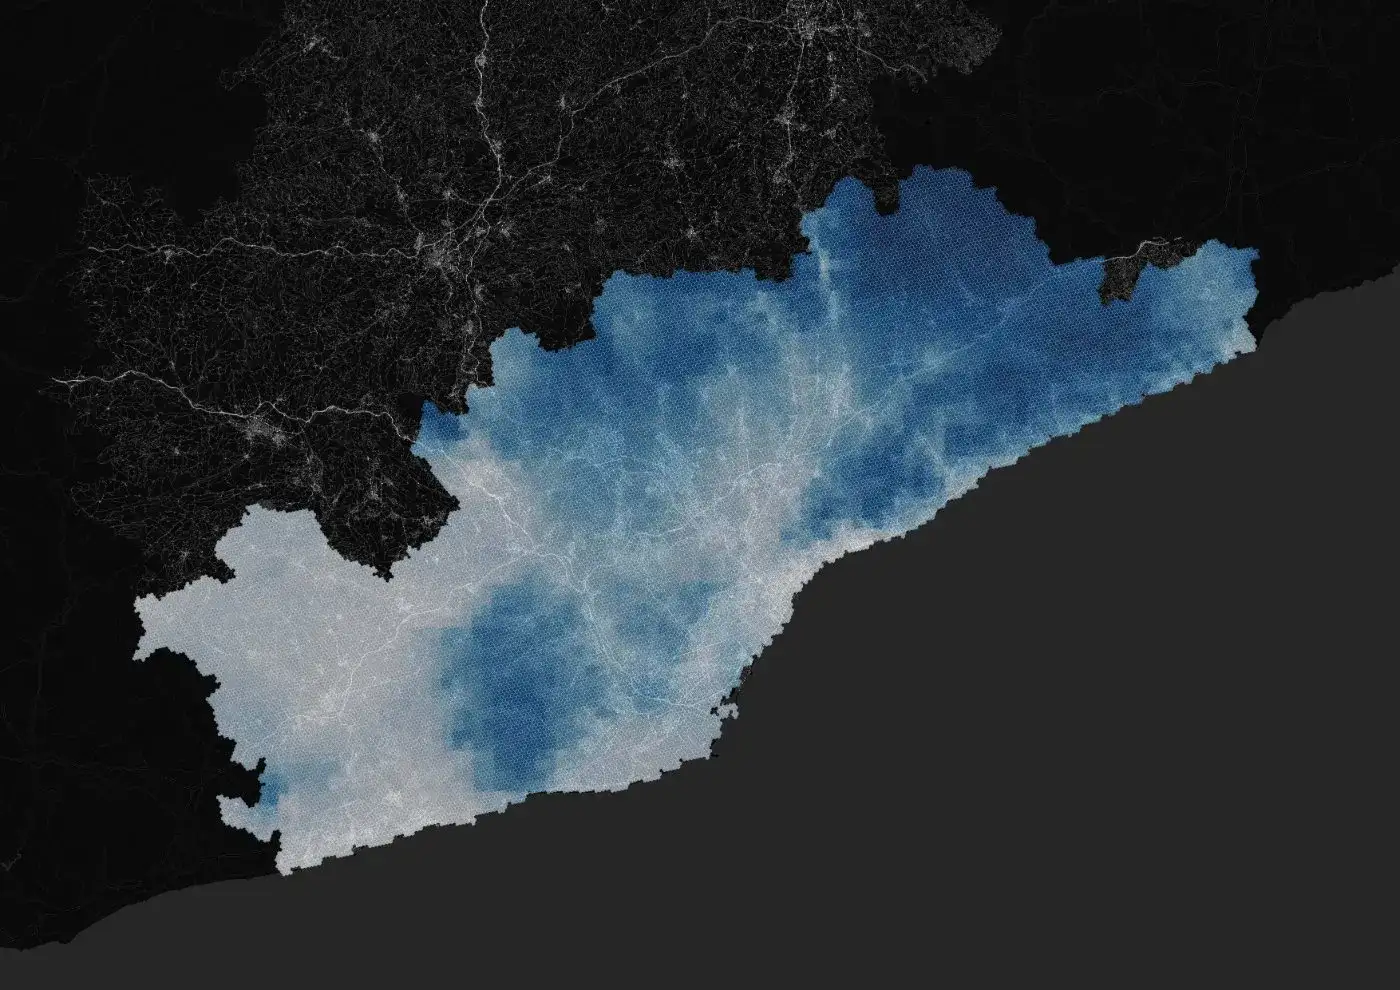
Rainfall totals, which govern how much moisture the landscape holds through summer.
Sensitivity inputs
Who lives in the heat, and what kind of buildings they live in.
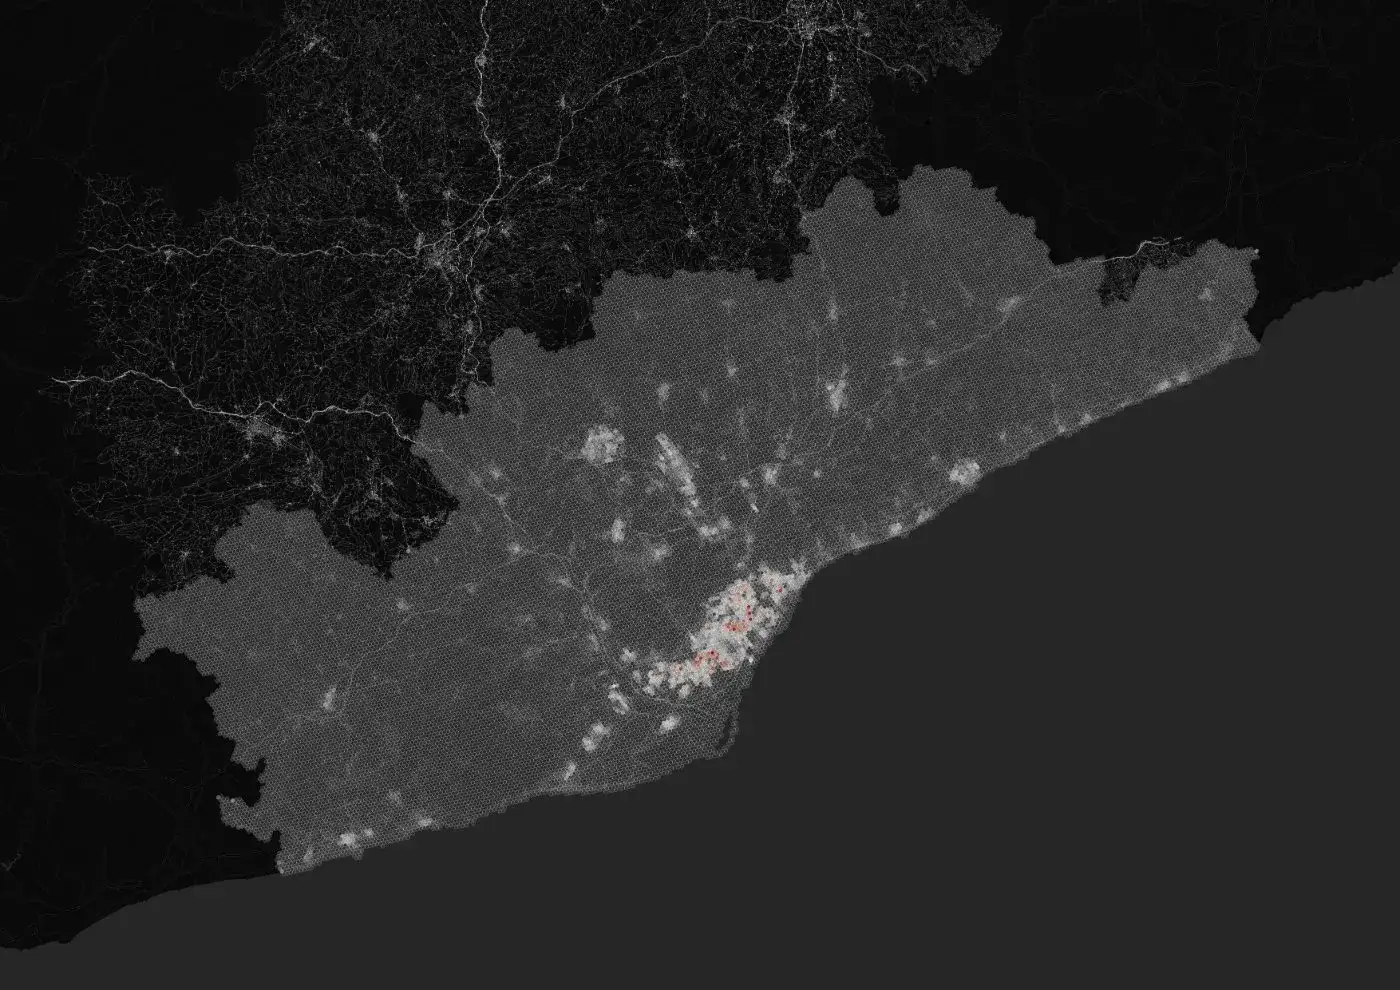
The group most at risk of dying in a heatwave.
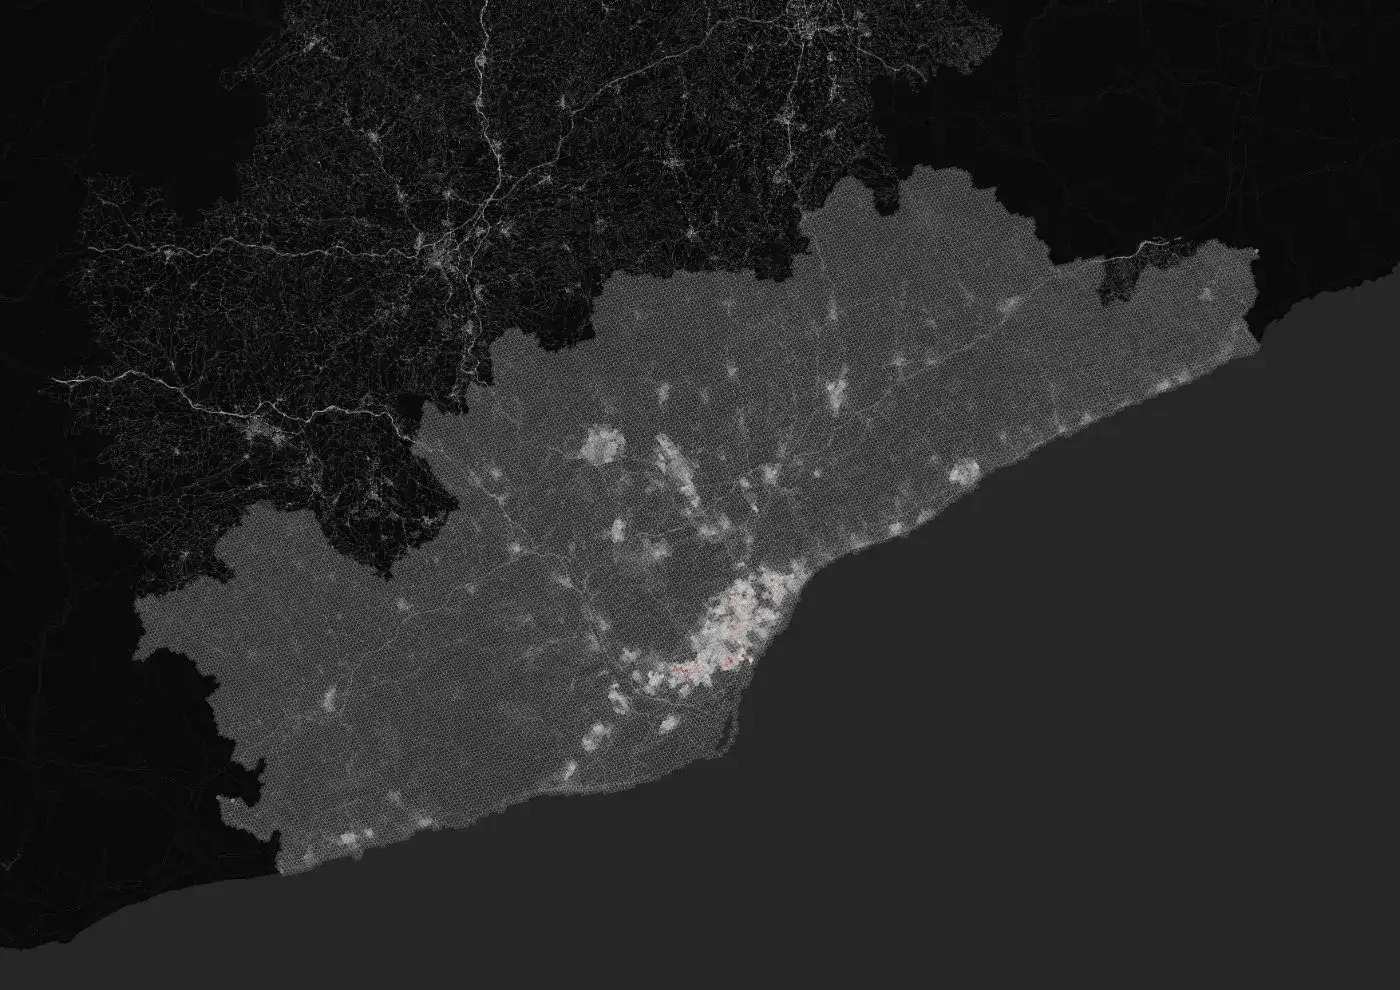
Where people actually live, at hexagon resolution.
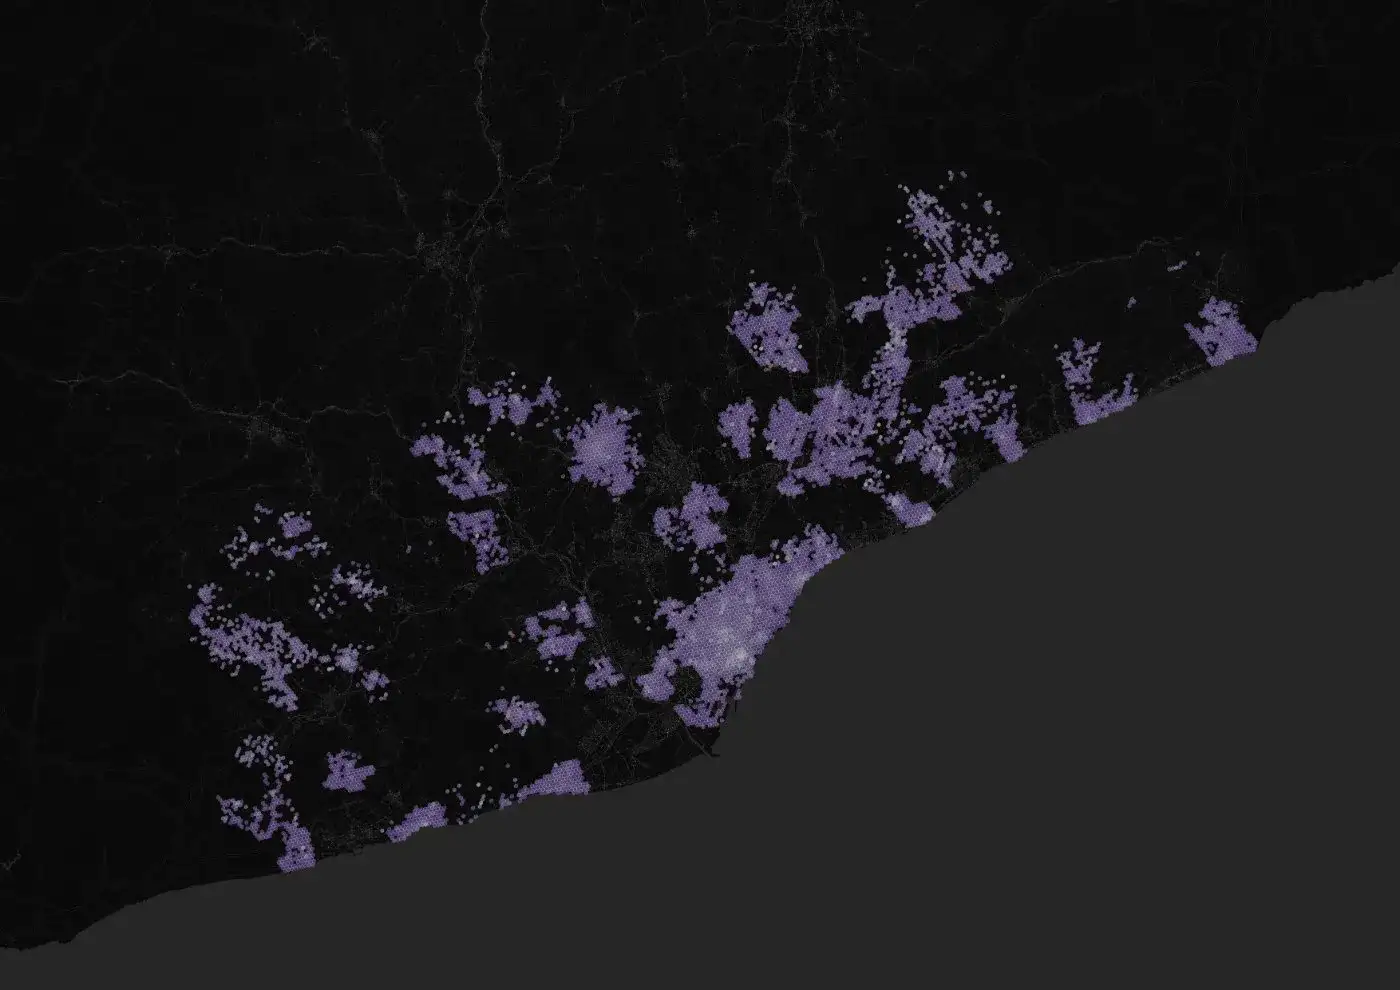
Share of stock built before 1980, with no thermal insulation.
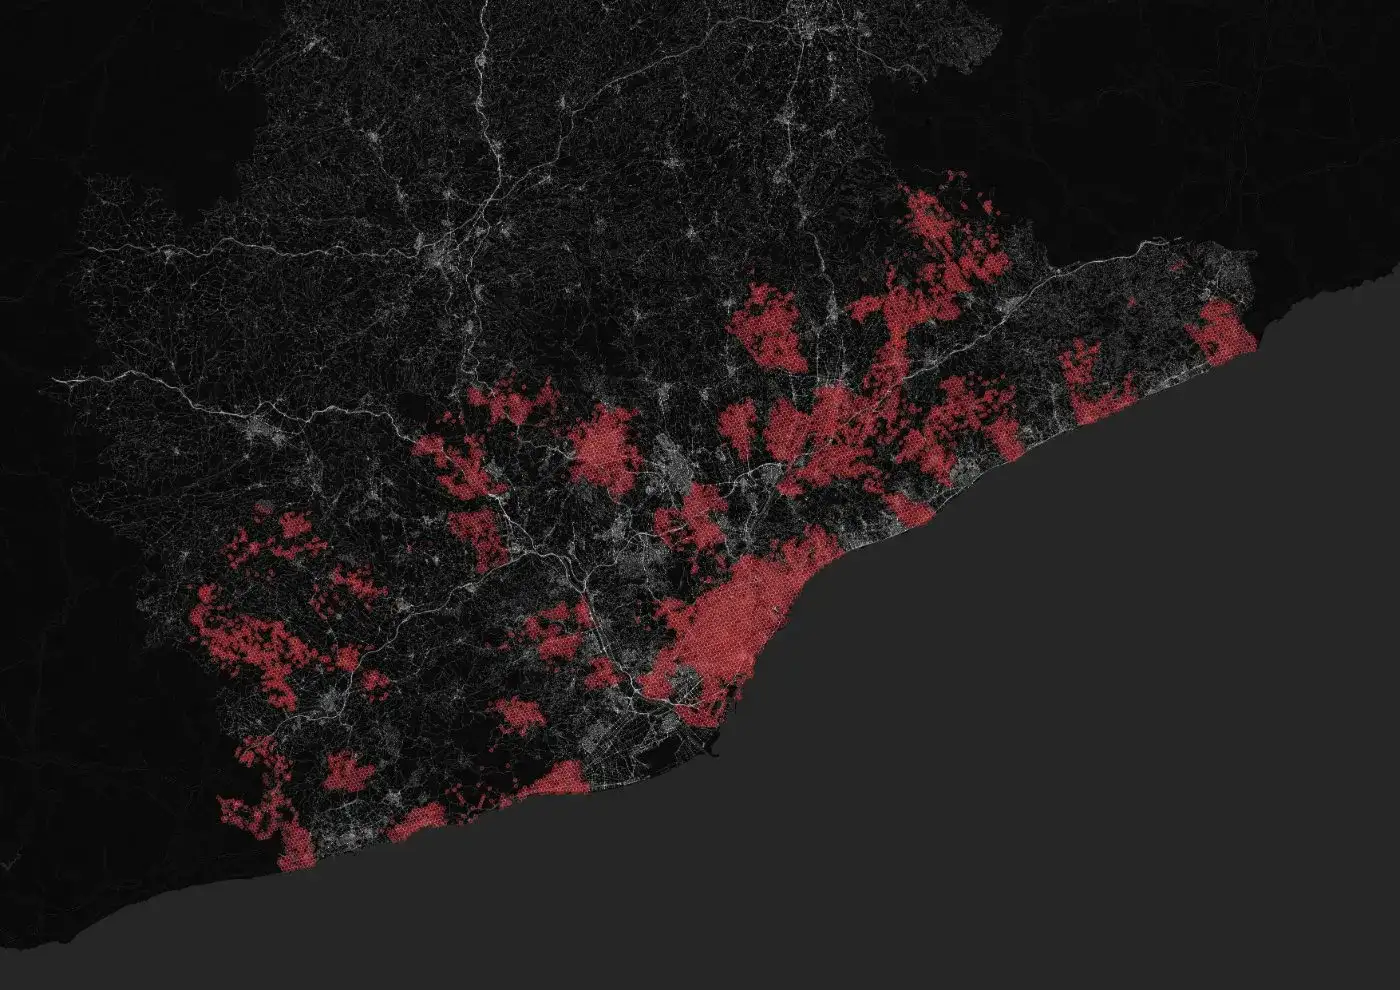
The typical vintage of each neighbourhood's buildings.
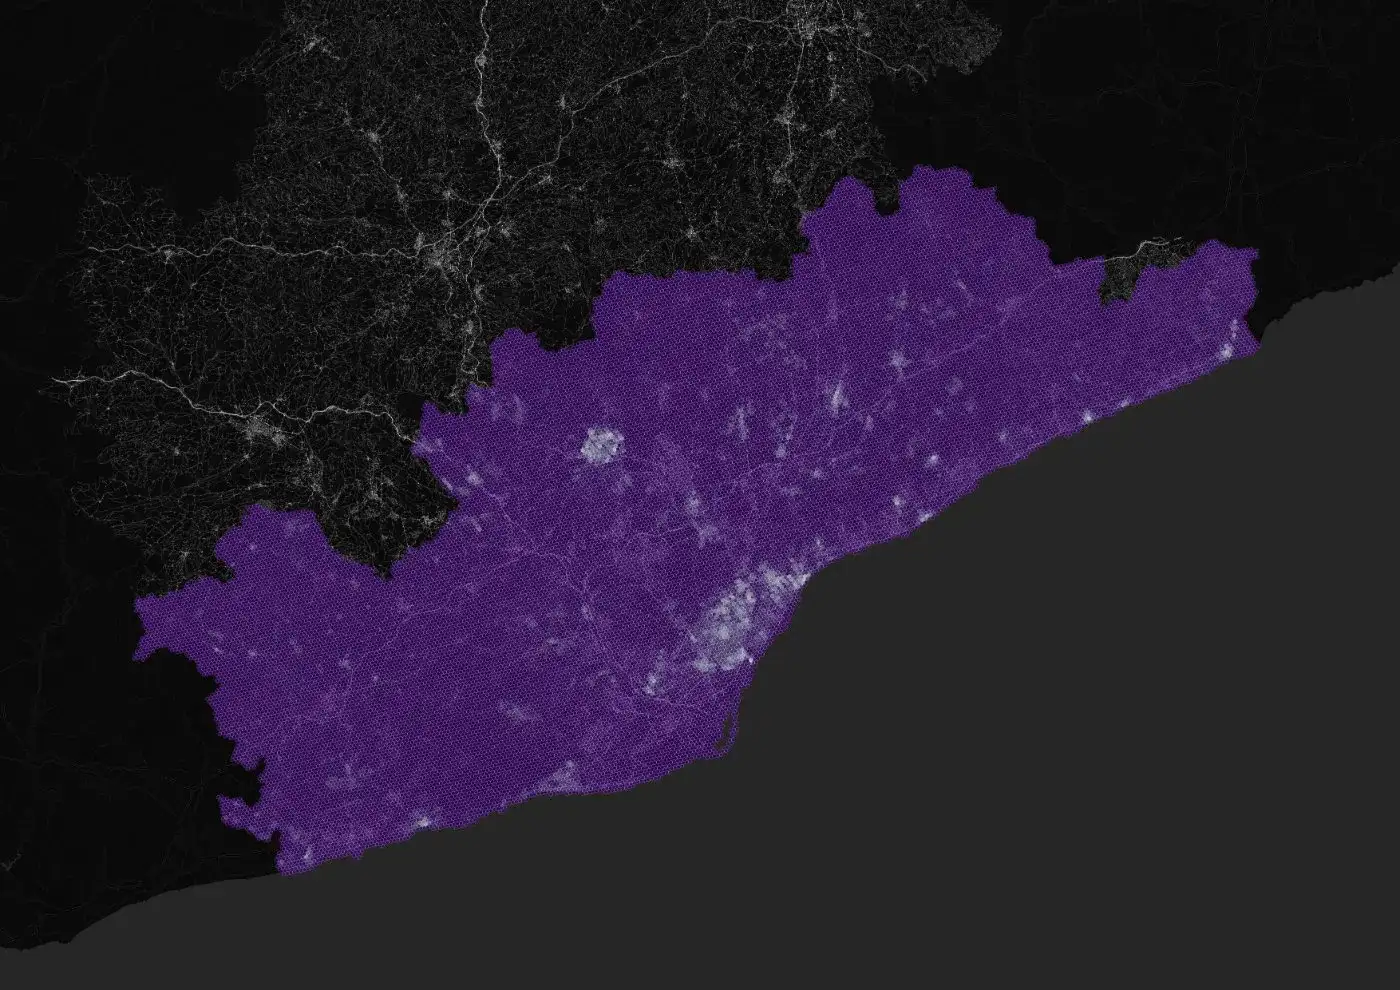
Density of structures, which drives the urban heat island.
Adaptive capacity inputs
The resources a place has to cope, and where people can go to cool down.
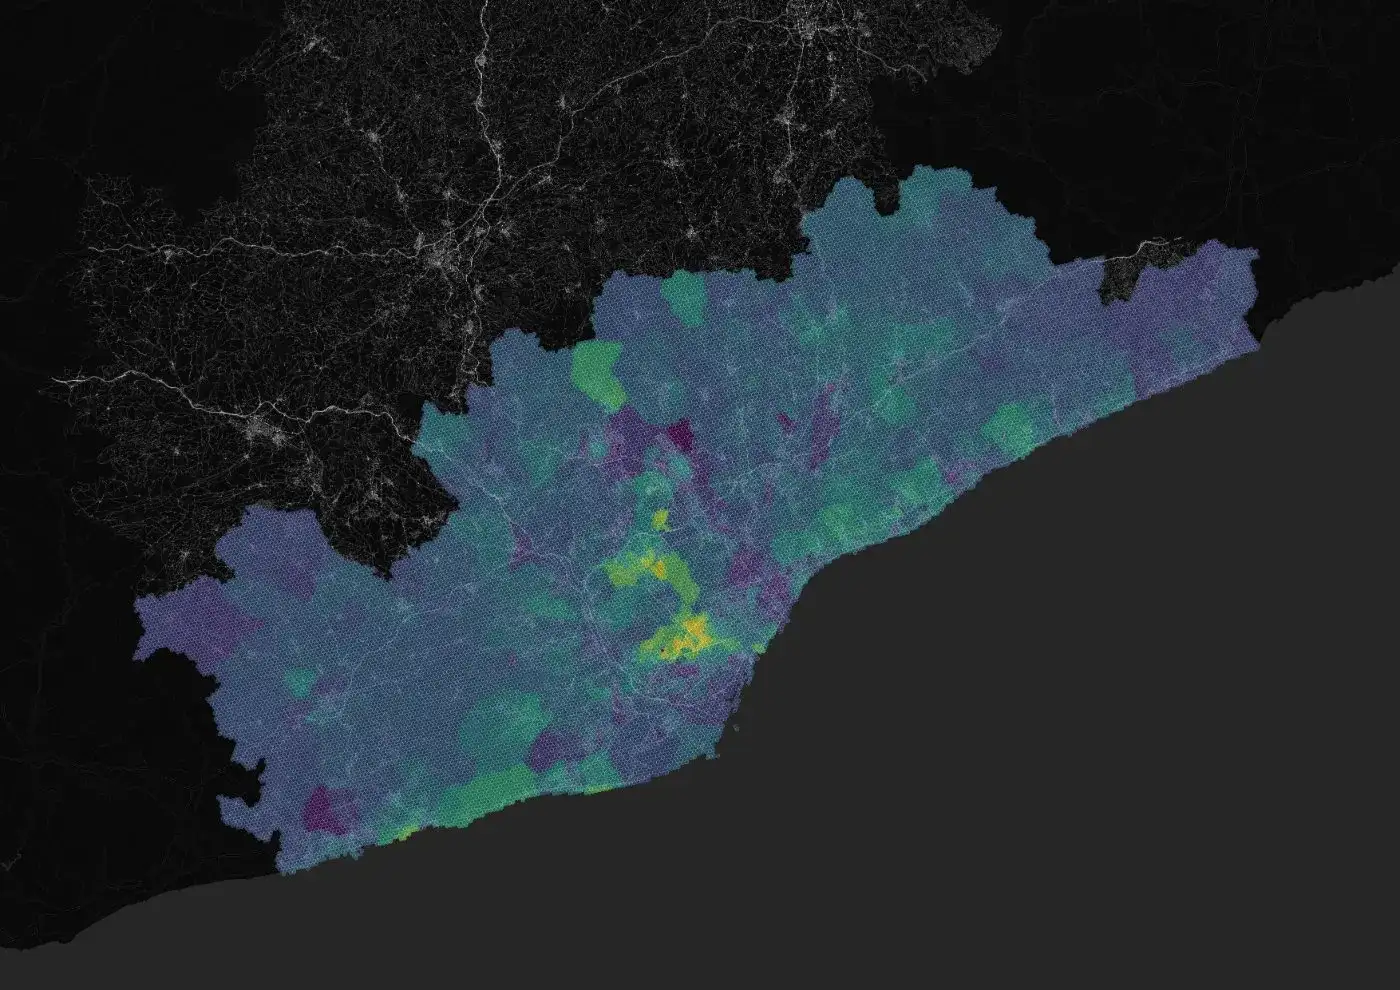
Capacity to run air conditioning, retrofit a home, or leave the city.
How unevenly that capacity is distributed within each area.
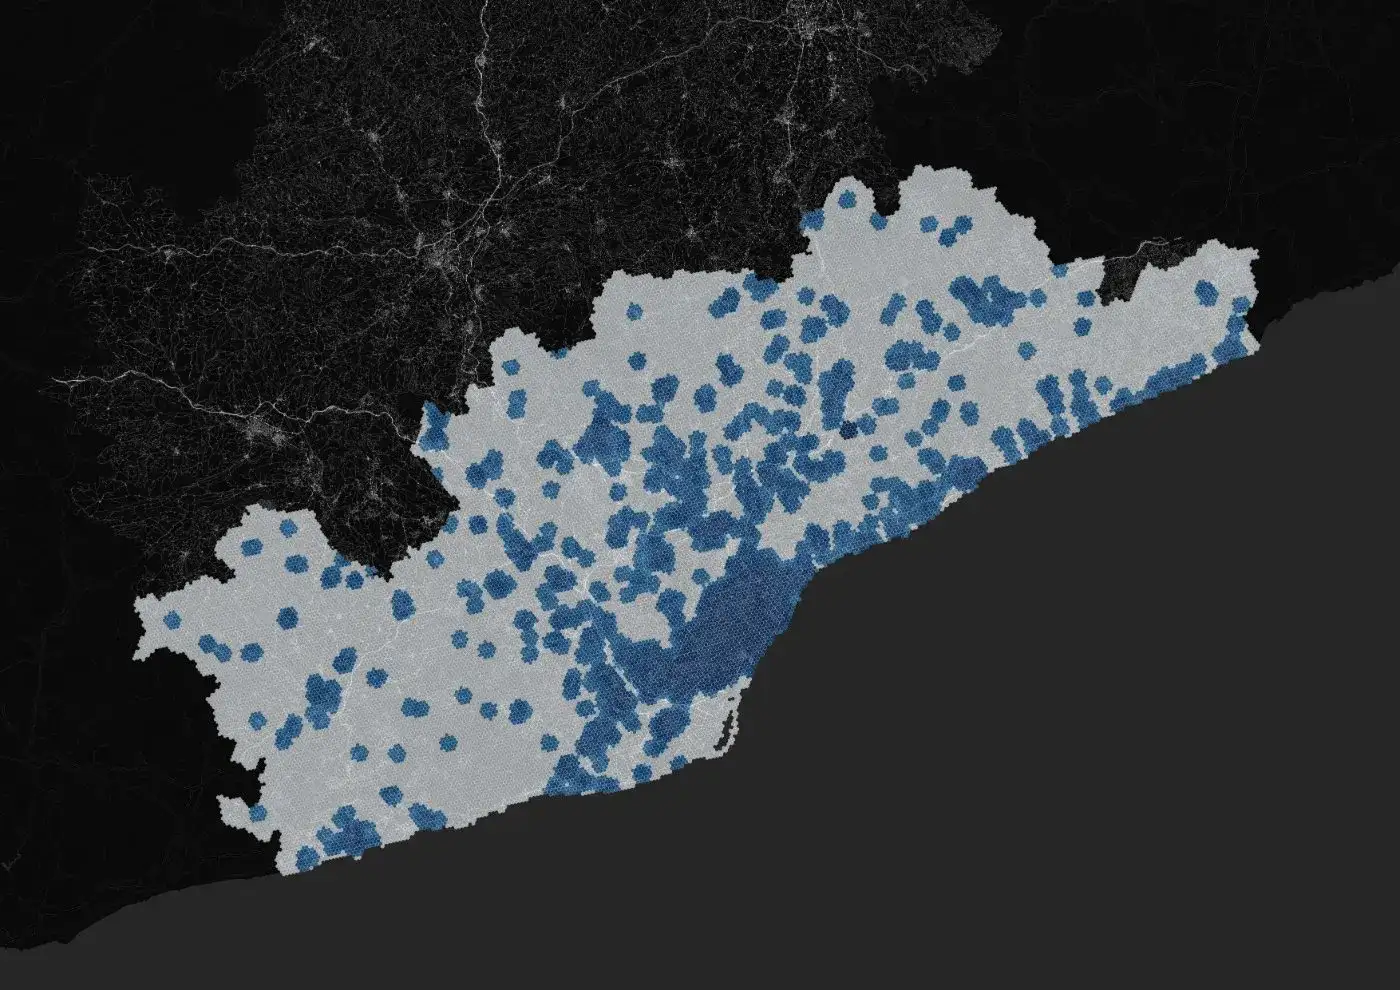
Access to the network of designated climate shelters and cool public space.